Gold recovered the $4,500 mark, and US Treasury yields rebounded in tandem with the dollar.
2026-08-21 00:40:58
On Thursday (August 20), during the US trading session, gold retraced some of its intraday losses and climbed back above the $4,500 mark; after a sharp decline the previous day, US Treasury yields rebounded and the US dollar (USD) gradually stabilized. Gold prices reached a high of $4,540.63, rebounding from an intraday low of $4,456.  On Wednesday, the U.S. Treasury announced an expansion of its long-term Treasury bond liquidity repurchase operations, stimulating a single-day surge in gold prices exceeding 4%. Following the announcement, the 30-year Treasury yield fell by approximately 9 basis points to 5.18%, while the benchmark 10-year Treasury yield dropped by about 5 basis points to 4.63%. Earlier this week, the 30-year Treasury yield had briefly surpassed 5.30%, reaching a new high since 2007. This Treasury repurchase operation provided some breathing room for the bond market. However, by Thursday, both the 10-year and 30-year Treasury yields had rebounded by about 6 basis points. Analysts warned that while the repurchase operation could alleviate short-term pressure on the bond market, it could not solve deeper problems such as the massive fiscal deficit, large-scale bond issuance, and persistent inflation risks. Market concerns about fiscal vulnerabilities fueled safe-haven buying of gold, which was seen as a hedge against government debt expansion and fiscal uncertainty, limiting the downside potential of gold prices. U.S. Treasury Secretary Scott Bessant stated on Thursday that the bond repurchase operation could exceed $4 billion. Gold prices are also highly influenced by the Federal Reserve's monetary policy. TD Securities analysts pointed out, "The Treasury's signals of support for the long-term bond market, coupled with the Fed's willingness to tolerate rising energy prices, are sufficient to support gold prices in the short term." However, analysts also cautioned that the next substantial rise in gold prices will take time. "Currently, the market is still pricing in a rate hike in 2027. Only when the market is widely convinced that the Fed will maintain its current interest rates will gold begin a new upward trend." According to the CME FedWatch Tool, the market is currently betting on a 65% probability that the Fed will maintain its current interest rates in September, compared to only 35% a month ago. San Francisco Fed President Mary Daly stated on Thursday, "Rising bond yields do not constitute a signal of monetary policy adjustment; the Fed's current policy is within an appropriate range." She added that short-term yields reflect the market's understanding of the Fed's policy response logic, while emphasizing that the Fed's core mission is to achieve its inflation target. On the data front, US weekly labor force data provided some support for the dollar. Initial jobless claims in the US fell to 206,000, lower than the market expectation of 210,000, and the previous value of 212,000 (revised upward from 209,000). The US Dollar Index (DXY), which measures the dollar's performance against six major currencies, traded around 98.80, rebounding from an intraday low of 98.56, its lowest level since May 14. Technical Analysis: Spot gold is testing resistance at the 200-day moving average.
 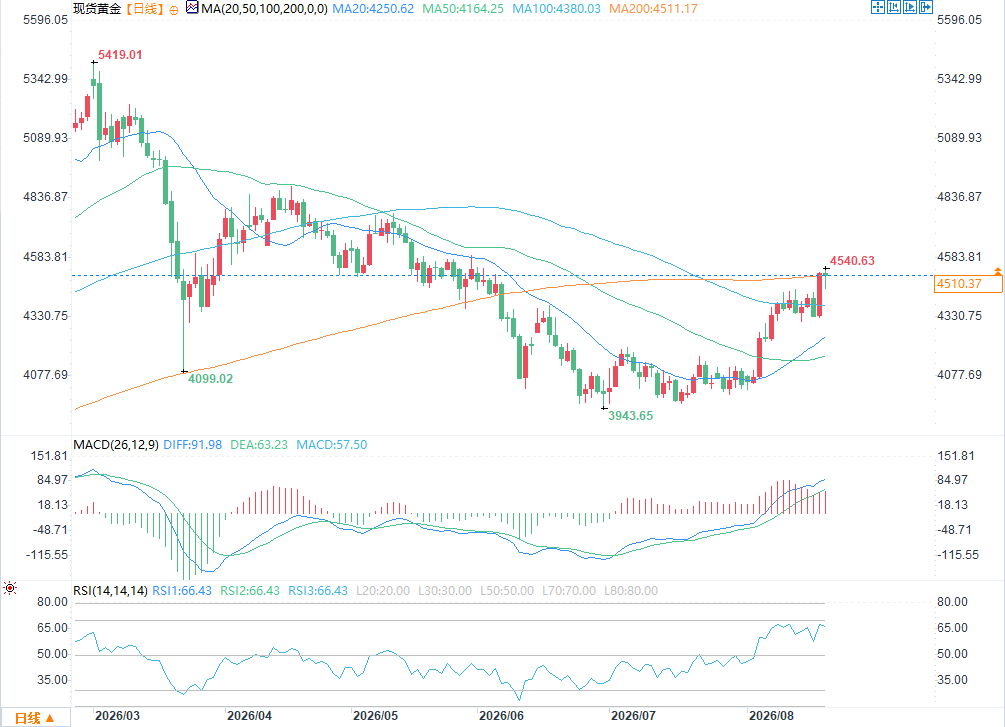 (Spot gold daily chart source: EasyForex) As can be seen from the daily chart, spot gold has stabilized above the 50-day moving average ($4164.25) and the 100-day moving average ($4380.03), indicating a clear short-term bullish trend. Currently, the gold price has risen to $4540.63, facing the key resistance level of the 200-day moving average at $4511.17. The K-line has already stood above this moving average, but has not yet completed a valid daily close confirmation. In terms of indicators: the RSI (14) reading is 66.43, entering the strong zone, but has not yet reached the overbought threshold; the DIFF and DEA lines of the MACD continue to rise, and the MACD histogram maintains positive expansion, indicating strong upward momentum. Key Price Levels Analysis Upside: If the daily close holds above the 200-day moving average of $4511.17, gold prices will open up upward potential, with the next target at the $4650 resistance level. Downside: The first support level is the 100-day moving average at $4380.03, followed by the 50-day moving average at $4164.25, with deeper support at the psychological level of $4000. Historical Chart Reference: This round of price action started its rebound from a low of $3943.65, with the previous high of $5419.01 acting as strong medium-term resistance.
On Wednesday, the U.S. Treasury announced an expansion of its long-term Treasury bond liquidity repurchase operations, stimulating a single-day surge in gold prices exceeding 4%. Following the announcement, the 30-year Treasury yield fell by approximately 9 basis points to 5.18%, while the benchmark 10-year Treasury yield dropped by about 5 basis points to 4.63%. Earlier this week, the 30-year Treasury yield had briefly surpassed 5.30%, reaching a new high since 2007. This Treasury repurchase operation provided some breathing room for the bond market. However, by Thursday, both the 10-year and 30-year Treasury yields had rebounded by about 6 basis points. Analysts warned that while the repurchase operation could alleviate short-term pressure on the bond market, it could not solve deeper problems such as the massive fiscal deficit, large-scale bond issuance, and persistent inflation risks. Market concerns about fiscal vulnerabilities fueled safe-haven buying of gold, which was seen as a hedge against government debt expansion and fiscal uncertainty, limiting the downside potential of gold prices. U.S. Treasury Secretary Scott Bessant stated on Thursday that the bond repurchase operation could exceed $4 billion. Gold prices are also highly influenced by the Federal Reserve's monetary policy. TD Securities analysts pointed out, "The Treasury's signals of support for the long-term bond market, coupled with the Fed's willingness to tolerate rising energy prices, are sufficient to support gold prices in the short term." However, analysts also cautioned that the next substantial rise in gold prices will take time. "Currently, the market is still pricing in a rate hike in 2027. Only when the market is widely convinced that the Fed will maintain its current interest rates will gold begin a new upward trend." According to the CME FedWatch Tool, the market is currently betting on a 65% probability that the Fed will maintain its current interest rates in September, compared to only 35% a month ago. San Francisco Fed President Mary Daly stated on Thursday, "Rising bond yields do not constitute a signal of monetary policy adjustment; the Fed's current policy is within an appropriate range." She added that short-term yields reflect the market's understanding of the Fed's policy response logic, while emphasizing that the Fed's core mission is to achieve its inflation target. On the data front, US weekly labor force data provided some support for the dollar. Initial jobless claims in the US fell to 206,000, lower than the market expectation of 210,000, and the previous value of 212,000 (revised upward from 209,000). The US Dollar Index (DXY), which measures the dollar's performance against six major currencies, traded around 98.80, rebounding from an intraday low of 98.56, its lowest level since May 14. Technical Analysis: Spot gold is testing resistance at the 200-day moving average. (Spot gold daily chart source: EasyForex) As can be seen from the daily chart, spot gold has stabilized above the 50-day moving average ($4164.25) and the 100-day moving average ($4380.03), indicating a clear short-term bullish trend. Currently, the gold price has risen to $4540.63, facing the key resistance level of the 200-day moving average at $4511.17. The K-line has already stood above this moving average, but has not yet completed a valid daily close confirmation. In terms of indicators: the RSI (14) reading is 66.43, entering the strong zone, but has not yet reached the overbought threshold; the DIFF and DEA lines of the MACD continue to rise, and the MACD histogram maintains positive expansion, indicating strong upward momentum. Key Price Levels Analysis Upside: If the daily close holds above the 200-day moving average of $4511.17, gold prices will open up upward potential, with the next target at the $4650 resistance level. Downside: The first support level is the 100-day moving average at $4380.03, followed by the 50-day moving average at $4164.25, with deeper support at the psychological level of $4000. Historical Chart Reference: This round of price action started its rebound from a low of $3943.65, with the previous high of $5419.01 acting as strong medium-term resistance.
- Risk Warning and Disclaimer
- The market involves risk, and trading may not be suitable for all investors. This article is for reference only and does not constitute personal investment advice, nor does it take into account certain users’ specific investment objectives, financial situation, or other needs. Any investment decisions made based on this information are at your own risk.