













From above 101 to around 98, what exactly is being traded in this round of dollar repricing?
2026-08-21 19:26:58
On Friday, August 21, the US dollar index was near a three-month low, currently trading around 98.65, continuing its decline from the previous trading day. Meanwhile, the yield on the 10-year US Treasury note was approximately 4.69%, and the yield on the 30-year note was approximately 5.25%. It's worth noting that after the US Treasury expanded its long-term Treasury repurchase program, long-term yields initially fell but subsequently returned to near their highs, indicating that the market's understanding of this measure has shifted from simply improving liquidity to a reassessment of fiscal constraints, the term supply structure, and the inflation risk premium. Another clue changing the foreign exchange pricing structure comes from Japan. In July, national inflation rebounded, with the overall CPI reaching 1.9% year-on-year, core CPI at 1.8%, and core-core CPI excluding fresh food and energy rising to 1.9%. The Bank of Japan's current policy rate is around 1.0%, and its next monetary policy meeting is scheduled for September 17-18, thus significantly increasing market attention to further interest rate adjustments. The key contradiction in current dollar pricing is not whether the US Treasury is willing to intervene in the bond market, but whether repurchase agreements can change the risk premium behind long-term interest rates.  The latest arrangements show that the U.S. Treasury will increase the size of single repurchase agreements for some 10- to 30-year Treasury bonds from a maximum of approximately $2 billion to at least $4 billion. Its direct effect is primarily to improve the liquidity of older bonds, reduce supply-demand imbalances in specific maturities, and decrease market transaction friction. The quarterly financing arrangements announced in early August also indicate that the U.S. Treasury still needs to meet its large-scale financing needs through Treasury bills and bonds of different maturities. In other words, repurchase agreements are a liability management tool, not a tool to automatically reduce the fiscal deficit. U.S. Treasury Secretary Bessant recently stated that he will increase his focus on fiscal consolidation and indicated that there is still room for further adjustments to the size of long-term bond repurchase agreements. The problem is that the fiscal budget ultimately involves substantial changes in revenue and expenditure; therefore, the market's focus has shifted from policy statements to whether a quantifiable fiscal path can be formed. The recent rapid decline and subsequent rise in long-term yields after the announcement of the repurchase measures is the most direct market expression of this divergence. Under the traditional framework, high U.S. Treasury yields usually mean that dollar assets have a higher coupon rate advantage. However, the market is currently distinguishing between two completely different types of high yields. The first type of yield increase stems from real growth and monetary policy expectations; such yield increases typically imply higher returns on capital. The second type arises from fiscal risk, term premiums, and increased inflation uncertainty. Even if the latter also pushes up nominal yields, it may not simultaneously increase the relative attractiveness of dollar assets, as investors' demand for risk compensation expands concurrently. This explains the recent unstable correlation between the dollar and long-term yields. On August 21, the yield on the 10-year US Treasury note remained close to 4.69%, and the 30-year yield was around 5.25%, yet the dollar index hovered around 98.6. The fact that high yields did not mechanically translate into a stronger dollar indicates that the market is currently more focused on why yields are high, rather than simply looking at the absolute level of yields. Meanwhile, energy prices remain a variable that cannot be ignored. High oil prices suggest a potential resurgence in inflation expectations, thus affecting long-term bond term premiums and expectations of Federal Reserve policy. Therefore, the current dollar price is not simply a trade-off of interest rate cuts, but a complex pricing mechanism influenced by fiscal risk, inflation risk, safe-haven demand, and relative interest rate differentials. Observing the current daily chart structure of the US dollar index, the price has clearly been trading below the Bollinger Middle Band and continues to approach the lower band area, with the Middle Band itself starting to slope downwards. After the index previously fell rapidly from above 101, it did not immediately recover to the original oscillation center, but instead formed a continuous consolidation in the lower area, which means that the short-term price center of gravity has shifted downwards.
 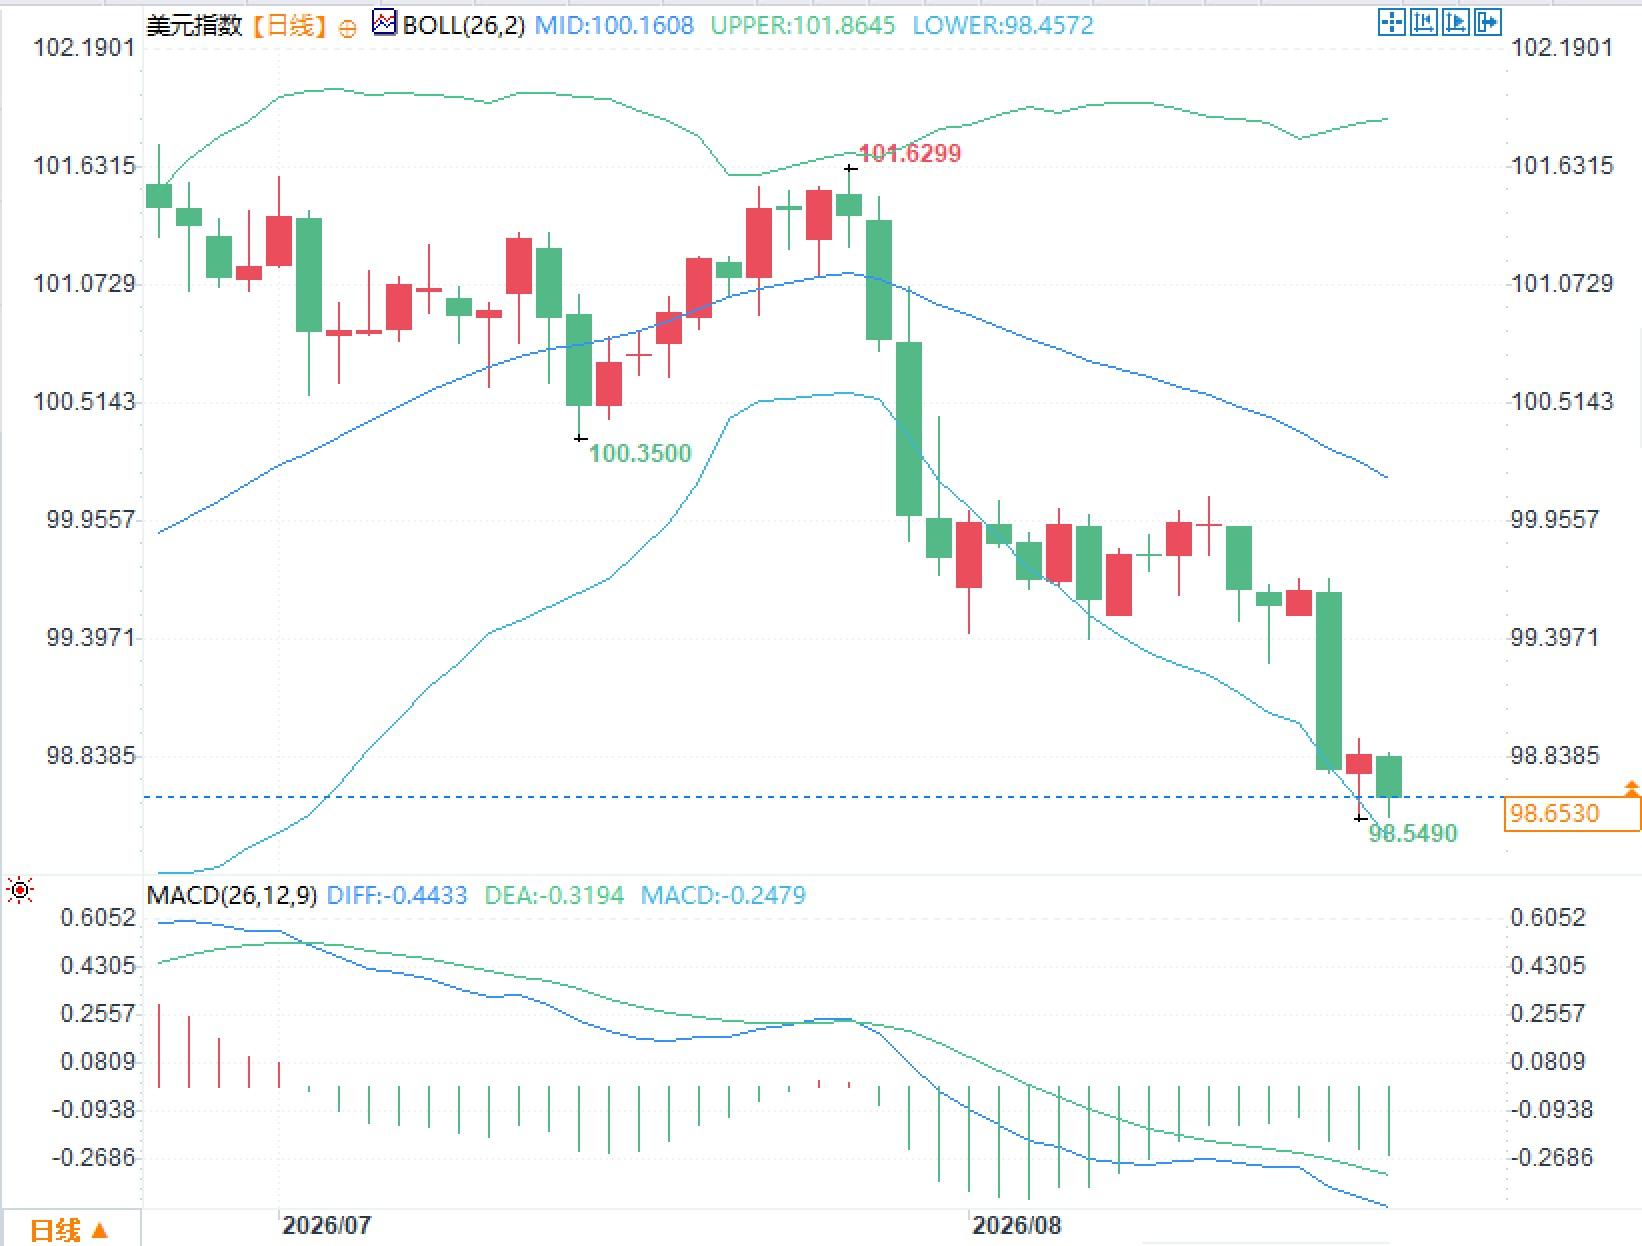 In terms of MACD, both the DIFF and DEA are currently running below the zero axis, with the DIFF still lower than the DEA, and the histogram remaining below the zero axis. Meanwhile, the price is approaching the lower Bollinger Band, indicating that short-term fluctuations have clearly deviated from the central range. More noteworthy is the volatility structure. After the US dollar index previously fell rapidly from around 101, the daily candlestick body significantly enlarged, followed by a period of low-level consolidation, suggesting that the market is currently rebalancing multiple variables such as fiscal policy, long-term bond yields, and energy prices.
The latest arrangements show that the U.S. Treasury will increase the size of single repurchase agreements for some 10- to 30-year Treasury bonds from a maximum of approximately $2 billion to at least $4 billion. Its direct effect is primarily to improve the liquidity of older bonds, reduce supply-demand imbalances in specific maturities, and decrease market transaction friction. The quarterly financing arrangements announced in early August also indicate that the U.S. Treasury still needs to meet its large-scale financing needs through Treasury bills and bonds of different maturities. In other words, repurchase agreements are a liability management tool, not a tool to automatically reduce the fiscal deficit. U.S. Treasury Secretary Bessant recently stated that he will increase his focus on fiscal consolidation and indicated that there is still room for further adjustments to the size of long-term bond repurchase agreements. The problem is that the fiscal budget ultimately involves substantial changes in revenue and expenditure; therefore, the market's focus has shifted from policy statements to whether a quantifiable fiscal path can be formed. The recent rapid decline and subsequent rise in long-term yields after the announcement of the repurchase measures is the most direct market expression of this divergence. Under the traditional framework, high U.S. Treasury yields usually mean that dollar assets have a higher coupon rate advantage. However, the market is currently distinguishing between two completely different types of high yields. The first type of yield increase stems from real growth and monetary policy expectations; such yield increases typically imply higher returns on capital. The second type arises from fiscal risk, term premiums, and increased inflation uncertainty. Even if the latter also pushes up nominal yields, it may not simultaneously increase the relative attractiveness of dollar assets, as investors' demand for risk compensation expands concurrently. This explains the recent unstable correlation between the dollar and long-term yields. On August 21, the yield on the 10-year US Treasury note remained close to 4.69%, and the 30-year yield was around 5.25%, yet the dollar index hovered around 98.6. The fact that high yields did not mechanically translate into a stronger dollar indicates that the market is currently more focused on why yields are high, rather than simply looking at the absolute level of yields. Meanwhile, energy prices remain a variable that cannot be ignored. High oil prices suggest a potential resurgence in inflation expectations, thus affecting long-term bond term premiums and expectations of Federal Reserve policy. Therefore, the current dollar price is not simply a trade-off of interest rate cuts, but a complex pricing mechanism influenced by fiscal risk, inflation risk, safe-haven demand, and relative interest rate differentials. Observing the current daily chart structure of the US dollar index, the price has clearly been trading below the Bollinger Middle Band and continues to approach the lower band area, with the Middle Band itself starting to slope downwards. After the index previously fell rapidly from above 101, it did not immediately recover to the original oscillation center, but instead formed a continuous consolidation in the lower area, which means that the short-term price center of gravity has shifted downwards. In terms of MACD, both the DIFF and DEA are currently running below the zero axis, with the DIFF still lower than the DEA, and the histogram remaining below the zero axis. Meanwhile, the price is approaching the lower Bollinger Band, indicating that short-term fluctuations have clearly deviated from the central range. More noteworthy is the volatility structure. After the US dollar index previously fell rapidly from around 101, the daily candlestick body significantly enlarged, followed by a period of low-level consolidation, suggesting that the market is currently rebalancing multiple variables such as fiscal policy, long-term bond yields, and energy prices.
- Risk Warning and Disclaimer
- The market involves risk, and trading may not be suitable for all investors. This article is for reference only and does not constitute personal investment advice, nor does it take into account certain users’ specific investment objectives, financial situation, or other needs. Any investment decisions made based on this information are at your own risk.

