Gold prices retreated from $4,700 as easing tensions in the Hormuz weakened safe-haven demand.
2026-08-26 03:05:01
Gold prices remained volatile during North American trading hours on Tuesday (August 25), with bulls failing to break through the $4,700 mark. Prices subsequently fell further below this key psychological level, driven by mixed US data and growing market expectations for a resolution to the US-Iran conflict. Spot gold was trading at $4,653.47, up 0.04%.  Overbought signals coupled with positive news from the Middle East pressured a pullback in spot gold prices. Gold entered a consolidation phase, with bullish momentum waning and the Relative Strength Index (RSI) entering overbought territory. Geopolitical tensions remain a key factor: Axios News, citing two US officials, confirmed that President Trump announced the US Navy had cleared the Strait of Hormuz's navigation lanes. Strong resistance formed around $4700, suppressing gold prices. Meanwhile, US housing data showed a slight recovery; the 4-week moving average of ADP employment change was 11,750, higher than the previous 9,500. US building permits rose 4.3% month-on-month in July to 1.433 million units, reversing the 2.6% decline in June, but falling short of market expectations of 5%. The Conference Board's Consumer Confidence Index missed expectations, recording 90.2. Residents' views on the business environment and job market improved slightly in August. Boston Fed President Susan Collins signaled a hawkish stance, emphasizing that inflation remains too high and expressing concern about price stability. She believes the labor market is near full employment and economic growth is close to trend. According to Prime Terminal data, the money market remains skeptical about a September rate hike by the Fed: the market is betting on a 25 basis point rate hike with a probability of about 43%, and maintaining the current rate with a probability of 57%. The market will now focus on the Fed's preferred inflation indicator—the core personal consumption expenditures (PCE) price index—and the speech by new Fed Chairman Kevin Warsh at the Jackson Hole Economic Symposium. The US will also release durable goods orders, GDP, and initial jobless claims data later. Spot gold technical outlook: resistance at $4700.
 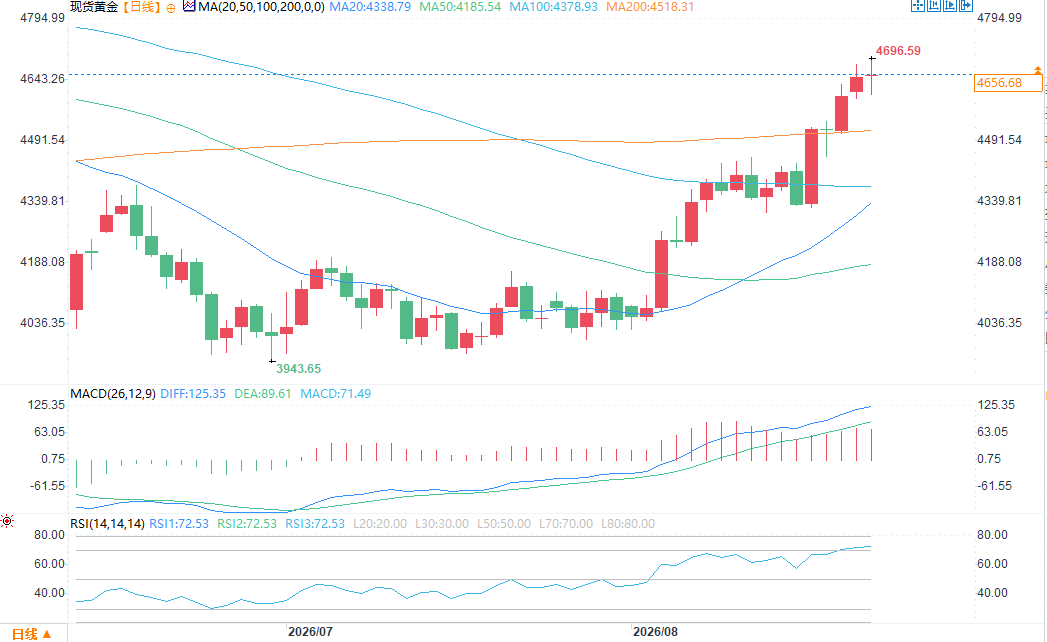 Gold traded sideways for the second consecutive day, with bulls unable to break through $4,700, and prices subsequently retreated to around $4,650. The RSI indicator is above the overbought threshold of 70 and is turning downwards. If the RSI falls below 70, spot gold may further test key support levels. The first support level is $4,600, followed by the 200-day simple moving average (SMA) at $4,519; below that is the $4,500 level, and then the 100-day moving average at $4,379. For a renewed upward trend, gold prices must regain a foothold above $4,700. A successful break above this level could see a move towards the May 7 high of $4,764, followed by a test of $4,800, with the next target at $5,000.
Overbought signals coupled with positive news from the Middle East pressured a pullback in spot gold prices. Gold entered a consolidation phase, with bullish momentum waning and the Relative Strength Index (RSI) entering overbought territory. Geopolitical tensions remain a key factor: Axios News, citing two US officials, confirmed that President Trump announced the US Navy had cleared the Strait of Hormuz's navigation lanes. Strong resistance formed around $4700, suppressing gold prices. Meanwhile, US housing data showed a slight recovery; the 4-week moving average of ADP employment change was 11,750, higher than the previous 9,500. US building permits rose 4.3% month-on-month in July to 1.433 million units, reversing the 2.6% decline in June, but falling short of market expectations of 5%. The Conference Board's Consumer Confidence Index missed expectations, recording 90.2. Residents' views on the business environment and job market improved slightly in August. Boston Fed President Susan Collins signaled a hawkish stance, emphasizing that inflation remains too high and expressing concern about price stability. She believes the labor market is near full employment and economic growth is close to trend. According to Prime Terminal data, the money market remains skeptical about a September rate hike by the Fed: the market is betting on a 25 basis point rate hike with a probability of about 43%, and maintaining the current rate with a probability of 57%. The market will now focus on the Fed's preferred inflation indicator—the core personal consumption expenditures (PCE) price index—and the speech by new Fed Chairman Kevin Warsh at the Jackson Hole Economic Symposium. The US will also release durable goods orders, GDP, and initial jobless claims data later. Spot gold technical outlook: resistance at $4700. Gold traded sideways for the second consecutive day, with bulls unable to break through $4,700, and prices subsequently retreated to around $4,650. The RSI indicator is above the overbought threshold of 70 and is turning downwards. If the RSI falls below 70, spot gold may further test key support levels. The first support level is $4,600, followed by the 200-day simple moving average (SMA) at $4,519; below that is the $4,500 level, and then the 100-day moving average at $4,379. For a renewed upward trend, gold prices must regain a foothold above $4,700. A successful break above this level could see a move towards the May 7 high of $4,764, followed by a test of $4,800, with the next target at $5,000.
- Risk Warning and Disclaimer
- The market involves risk, and trading may not be suitable for all investors. This article is for reference only and does not constitute personal investment advice, nor does it take into account certain users’ specific investment objectives, financial situation, or other needs. Any investment decisions made based on this information are at your own risk.