Why has the dollar market entered a narrow trading range after the decline in long-term bond yields?
2026-08-26 18:11:01
On Wednesday, August 26, the US dollar index, after a period of rapid fluctuation, re-entered a narrow range around 99. Meanwhile, the yield on the 30-year US Treasury bond fell from its recent highs, weakening the marginal impact of long-term interest rates on the dollar. Market focus has shifted from simply trading bond yields to the repricing of inflation, employment, and the Fed's policy response function. The Fed's July meeting maintained the target range for the federal funds rate at 3.50% to 3.75%, but three of the 12 voting officials advocated a 25-basis-point rate hike, indicating a significant disagreement within the committee regarding the degree of inflation constraints. The next policy meeting is scheduled for September 15-16, so the data released at the end of August and the information from the Jackson Hole meeting will directly influence the market's understanding of the policy path. Previously, a significant driver of dollar volatility was the yield on long-term US Treasury bonds. Rising long-term yields typically increase the nominal return on dollar assets, but when the rise in yields stems from term premiums, fiscal supply pressures, or a market revaluation of long-term inflation risks, there is no stable one-way relationship between the dollar and yields. The fact that the US dollar index has not shown a clear trend of expansion after long-term yields have recently fallen from their highs precisely indicates that the market is reducing its reliance on a single interest rate differential variable.  This is also the most noteworthy change in the current foreign exchange trading environment. Short-term interest rates reflect the Fed's policy expectations more, while long-term interest rates simultaneously include real interest rates, inflation compensation, fiscal supply, and term premiums. When the two release different signals, dollar pricing often enters a high-frequency data-driven phase. The fact that three votes in favor of a rate hike emerged at the Fed meeting in July further reinforced this policy uncertainty. In other words, the market is currently reassessing not whether a particular meeting will adjust interest rates, but rather which side the Fed will give more weight to when faced with both high inflation and cooling demand. The US consumer confidence index fell to 89.4 in August, lower than the revised 90.2 in July and hitting a near seven-month low. More noteworthy is the structural change: the current situation index rose 6.8 points to 121.2, but the expectations index fell 5.8 points to 68.2. This means that residents' assessment of the current environment has not deteriorated significantly, but confidence in future income, business environment, and the job market continues to decline. This combination is not straightforward for monetary policy. Cooling demand expectations usually mean that the economy's ability to withstand high interest rates is decreasing, but high inflation expectations will limit the scope for policy easing. The Consumer Price Index (CPI) rose 0.1% month-over-month and 3.4% year-over-year in July; the core CPI, excluding food and energy, rose 0.2% month-over-month and 2.5% year-over-year. The data indicates that price pressures have eased somewhat compared to the previous period, but there is still a long way to go before policy constraints are completely lifted. Therefore, the current dollar market faces a typical two-variable game: growth data determines the necessity of policy adjustments, while inflation data determines the scope for policy adjustments. Significant changes in either could alter the pricing relationship within the yield curve. The US July Personal Consumption Expenditures (PCE) price index will be released tonight. The already released June data shows that the overall PCE price index rose 3.7% year-over-year, and the core PCE rose 3.3% year-over-year, with month-over-month changes of -0.1% and +0.1%, respectively. The July CPI already shows a decline in the month-over-month increase in overall inflation; therefore, the core significance of this PCE is not to judge the level of a single inflation figure, but to examine whether there is a consistent change in price pressures for goods, services, and core components. If the different inflation indicators continue to diverge, the Fed's decision-making will become more difficult. Another key milestone is Federal Reserve Chairman Kevin Warsh's keynote speech at the Jackson Hole Economic Policy Symposium on August 28th, an event now on the Fed's official schedule. The minutes of the July meeting revealed a more pronounced policy divergence within the Fed. Therefore, the importance of this speech lies more in its policy framework, inflation tolerance, and data response mechanisms than simply signaling the next meeting's interest rate. Observing the daily chart of the US dollar index, after a rapid decline from above 101, the index is currently trading around 99. The Bollinger Bands have a middle band of approximately 99.94, an upper band of approximately 101.66, and a lower band of approximately 98.21. The index is below the middle band and close to the lower half of the channel. MACD data shows the DIFF is approximately -0.4366, the DEA is approximately -0.3759, and the histogram is approximately -0.1213, both lines below the zero line. The recent narrowing of the candlestick bodies indicates that after the rapid repricing in the previous period, daily volatility is entering a period of compression.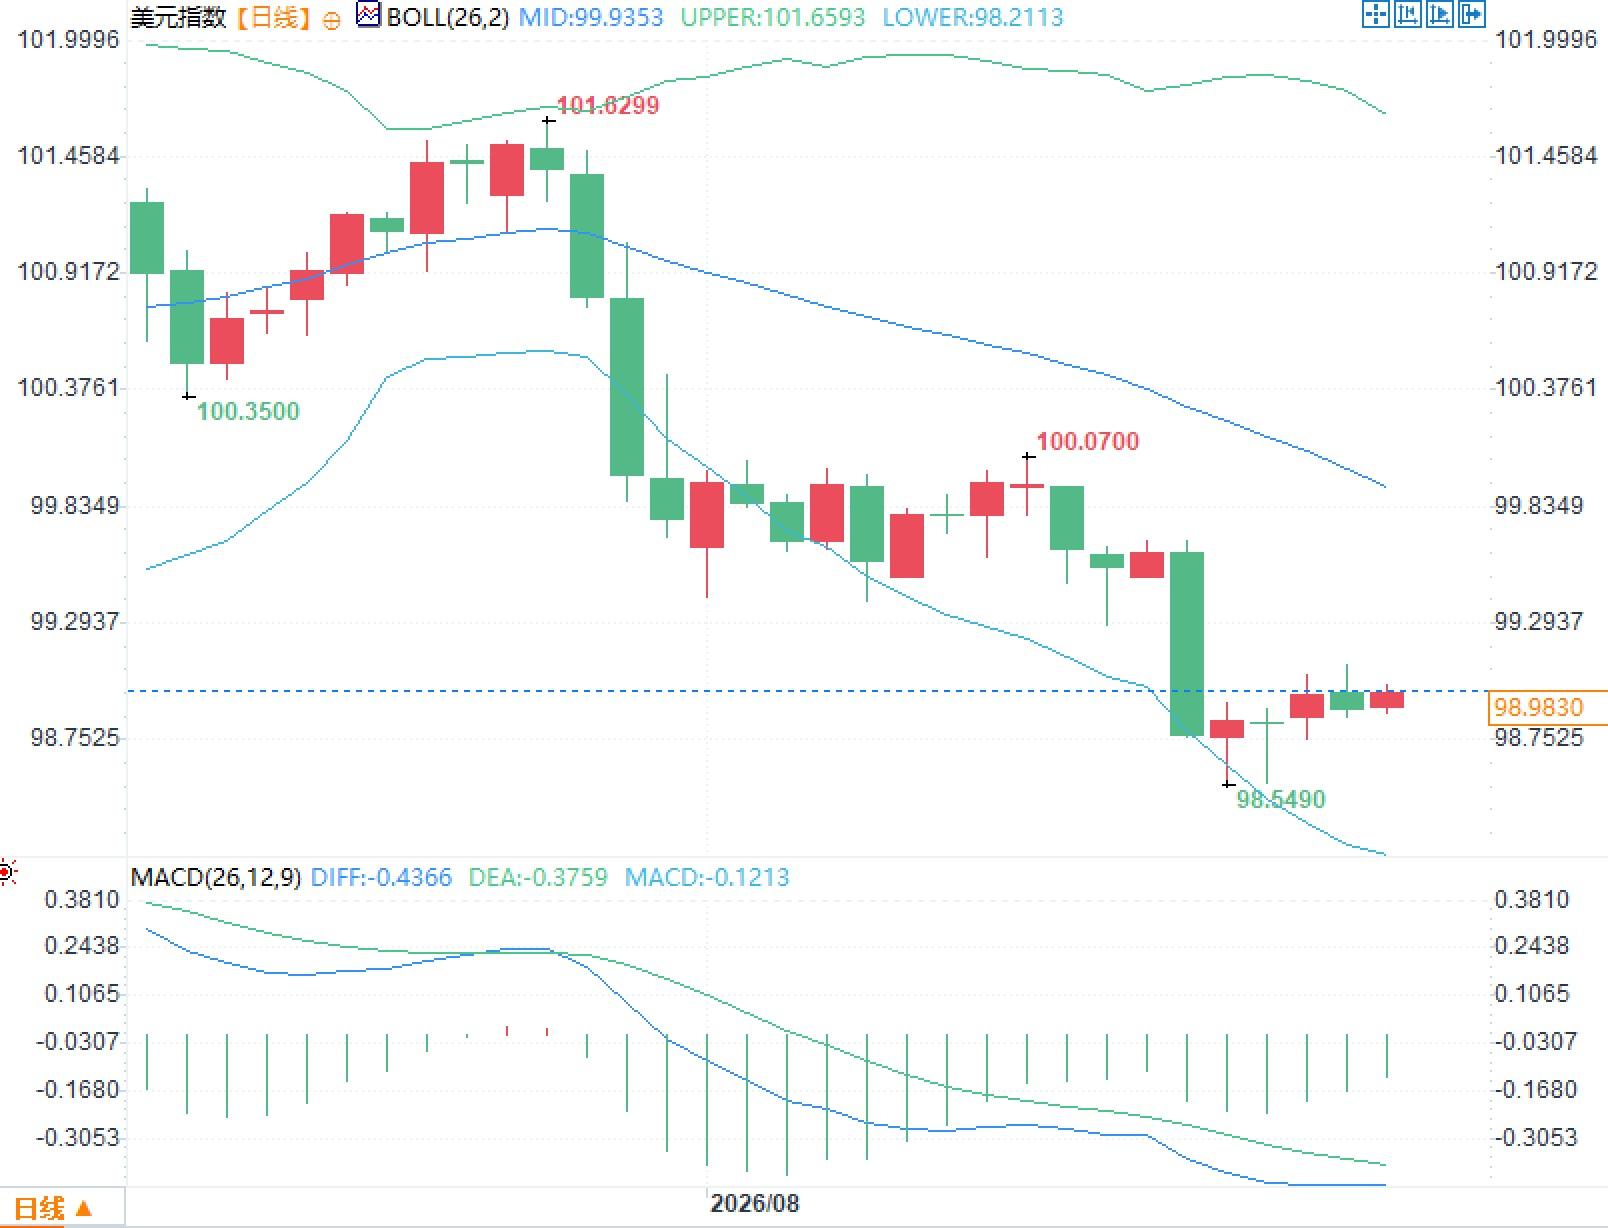
This is also the most noteworthy change in the current foreign exchange trading environment. Short-term interest rates reflect the Fed's policy expectations more, while long-term interest rates simultaneously include real interest rates, inflation compensation, fiscal supply, and term premiums. When the two release different signals, dollar pricing often enters a high-frequency data-driven phase. The fact that three votes in favor of a rate hike emerged at the Fed meeting in July further reinforced this policy uncertainty. In other words, the market is currently reassessing not whether a particular meeting will adjust interest rates, but rather which side the Fed will give more weight to when faced with both high inflation and cooling demand. The US consumer confidence index fell to 89.4 in August, lower than the revised 90.2 in July and hitting a near seven-month low. More noteworthy is the structural change: the current situation index rose 6.8 points to 121.2, but the expectations index fell 5.8 points to 68.2. This means that residents' assessment of the current environment has not deteriorated significantly, but confidence in future income, business environment, and the job market continues to decline. This combination is not straightforward for monetary policy. Cooling demand expectations usually mean that the economy's ability to withstand high interest rates is decreasing, but high inflation expectations will limit the scope for policy easing. The Consumer Price Index (CPI) rose 0.1% month-over-month and 3.4% year-over-year in July; the core CPI, excluding food and energy, rose 0.2% month-over-month and 2.5% year-over-year. The data indicates that price pressures have eased somewhat compared to the previous period, but there is still a long way to go before policy constraints are completely lifted. Therefore, the current dollar market faces a typical two-variable game: growth data determines the necessity of policy adjustments, while inflation data determines the scope for policy adjustments. Significant changes in either could alter the pricing relationship within the yield curve. The US July Personal Consumption Expenditures (PCE) price index will be released tonight. The already released June data shows that the overall PCE price index rose 3.7% year-over-year, and the core PCE rose 3.3% year-over-year, with month-over-month changes of -0.1% and +0.1%, respectively. The July CPI already shows a decline in the month-over-month increase in overall inflation; therefore, the core significance of this PCE is not to judge the level of a single inflation figure, but to examine whether there is a consistent change in price pressures for goods, services, and core components. If the different inflation indicators continue to diverge, the Fed's decision-making will become more difficult. Another key milestone is Federal Reserve Chairman Kevin Warsh's keynote speech at the Jackson Hole Economic Policy Symposium on August 28th, an event now on the Fed's official schedule. The minutes of the July meeting revealed a more pronounced policy divergence within the Fed. Therefore, the importance of this speech lies more in its policy framework, inflation tolerance, and data response mechanisms than simply signaling the next meeting's interest rate. Observing the daily chart of the US dollar index, after a rapid decline from above 101, the index is currently trading around 99. The Bollinger Bands have a middle band of approximately 99.94, an upper band of approximately 101.66, and a lower band of approximately 98.21. The index is below the middle band and close to the lower half of the channel. MACD data shows the DIFF is approximately -0.4366, the DEA is approximately -0.3759, and the histogram is approximately -0.1213, both lines below the zero line. The recent narrowing of the candlestick bodies indicates that after the rapid repricing in the previous period, daily volatility is entering a period of compression.
- Risk Warning and Disclaimer
- The market involves risk, and trading may not be suitable for all investors. This article is for reference only and does not constitute personal investment advice, nor does it take into account certain users’ specific investment objectives, financial situation, or other needs. Any investment decisions made based on this information are at your own risk.