PCE rose to 3.7%, but an unusual pricing phenomenon emerged in the gold market.
2026-08-27 18:01:03
On Thursday, August 27th, the international precious metals market entered a repricing phase after a period of high volatility. Spot gold, after briefly approaching $4700/ounce, gave back some of its gains and is currently trading around $4600/ounce. Meanwhile, the US dollar index remained above 99, and the yield on the 10-year US Treasury bond was at a relatively high level above 4.6%. The US July PCE price index rose 3.7% year-on-year, and core PCE rose 3.3% year-on-year, with inflation still significantly higher than the Federal Reserve's long-term target of 2%. Against the backdrop of the Jackson Hole symposium and Federal Reserve Chairman Kevin Warsh's upcoming keynote speech, the gold market is simultaneously digesting multiple variables, including inflation, real interest rates, the US dollar, long-term Treasury yields, and changes in financial conditions. The most noteworthy aspect of the latest PCE data is not the 0.2% monthly increase, but rather the continued stickiness of inflation. The overall PCE in July reached 3.7% year-on-year, while the core PCE was 3.3% year-on-year, the latter unchanged from the previous month. For precious metals, this means that the market cannot simply price based on the logic of a continued decline in inflation.  The Federal Reserve's target range for the federal funds rate remains at 3.50% to 3.75%. With nominal policy rates unchanged and core inflation remaining high, the core variable truly influencing gold valuations remains real interest rate expectations. If the market believes inflation will persist for an extended period, and policy rates need to remain at restrictive levels for longer, the opportunity cost of non-interest-bearing assets will increase. Conversely, if the rise in long-term yields stems more from term premiums, fiscal financing pressures, and changes in bond supply and demand structures than from improved real growth expectations, the traditional negative correlation between gold and Treasury yields may weaken temporarily. This is a key market characteristic of the recent simultaneous high levels of both gold and long-term yields. It's crucial to distinguish whether the rise in nominal yields originates from real interest rates, inflation compensation, or term premiums, as these three sources have entirely different implications for gold valuations. The market is focused on Kevin Warsh's speech on August 28th, but the real focus is not on any isolated phrase, but rather on how the Fed assesses recent changes in financial conditions. At the July policy meeting, the Fed voted 9-3 to keep rates unchanged, with three members supporting a 25 basis point rate hike. This voting structure indicates that internal tolerance for inflation risks is not entirely consistent. Meanwhile, the market's pricing in a September policy adjustment is significantly lower than in previous periods, with the current probability of a rate hike roughly in the 30-40% range. Therefore, if Warsh's speech discusses the relationship between inflation persistence, long-term yields, asset prices, and financial conditions, its market implications may be greater than simply reiterating the 2% inflation target. Particular attention should be paid to whether the Fed believes that some recent financial conditions have become excessively loose, and whether this change will slow the pace of inflation returning to the target. Gold is currently effectively caught between two pricing frameworks. One is the constraint of higher inflation corresponding to a longer period of restrictive interest rates; the other is the asset allocation demand driven by concerns about debt supply, term premiums, and currency purchasing power. The simultaneous existence of these two logics is the reason for the significant amplification of recent price volatility at high levels. The US dollar index is currently hovering around 99, recovering somewhat from its previous lows, but it has not formed a completely synchronized strengthening relationship with high Treasury yields. This is particularly important for gold. Normally, a stronger dollar and rising real yields would simultaneously increase the cost of holding gold, but recent changes in the long-term Treasury market include a clear term premium factor. The yield on 10-year US Treasury bonds is currently around 4.65%, while the 30-year yield remains above 5%, indicating that long-term funds require higher compensation for inflation, bond supply, and term risk. Therefore, it's premature to mechanically conclude that precious metals are under pressure simply because yields are rising. If the rise in yields stems from improved expectations of actual economic growth, the constraint on gold valuations is usually more direct; if it mainly comes from a widening term premium and an imbalance between supply and demand for long-term bonds, gold may simultaneously attract asset allocation demand. Observing the daily chart, gold prices are still clearly trading above the Bollinger Band's middle band, and after a rapid rise, have entered a period of consolidation at high levels. The Bollinger Band's middle band continues to rise, and the upper band is also expanding upwards, indicating a significant upward shift in the previous price fluctuation center. However, the price has fluctuated after repeatedly approaching the upper band, which also means that short-term volatility and holding costs are being readjusted.
 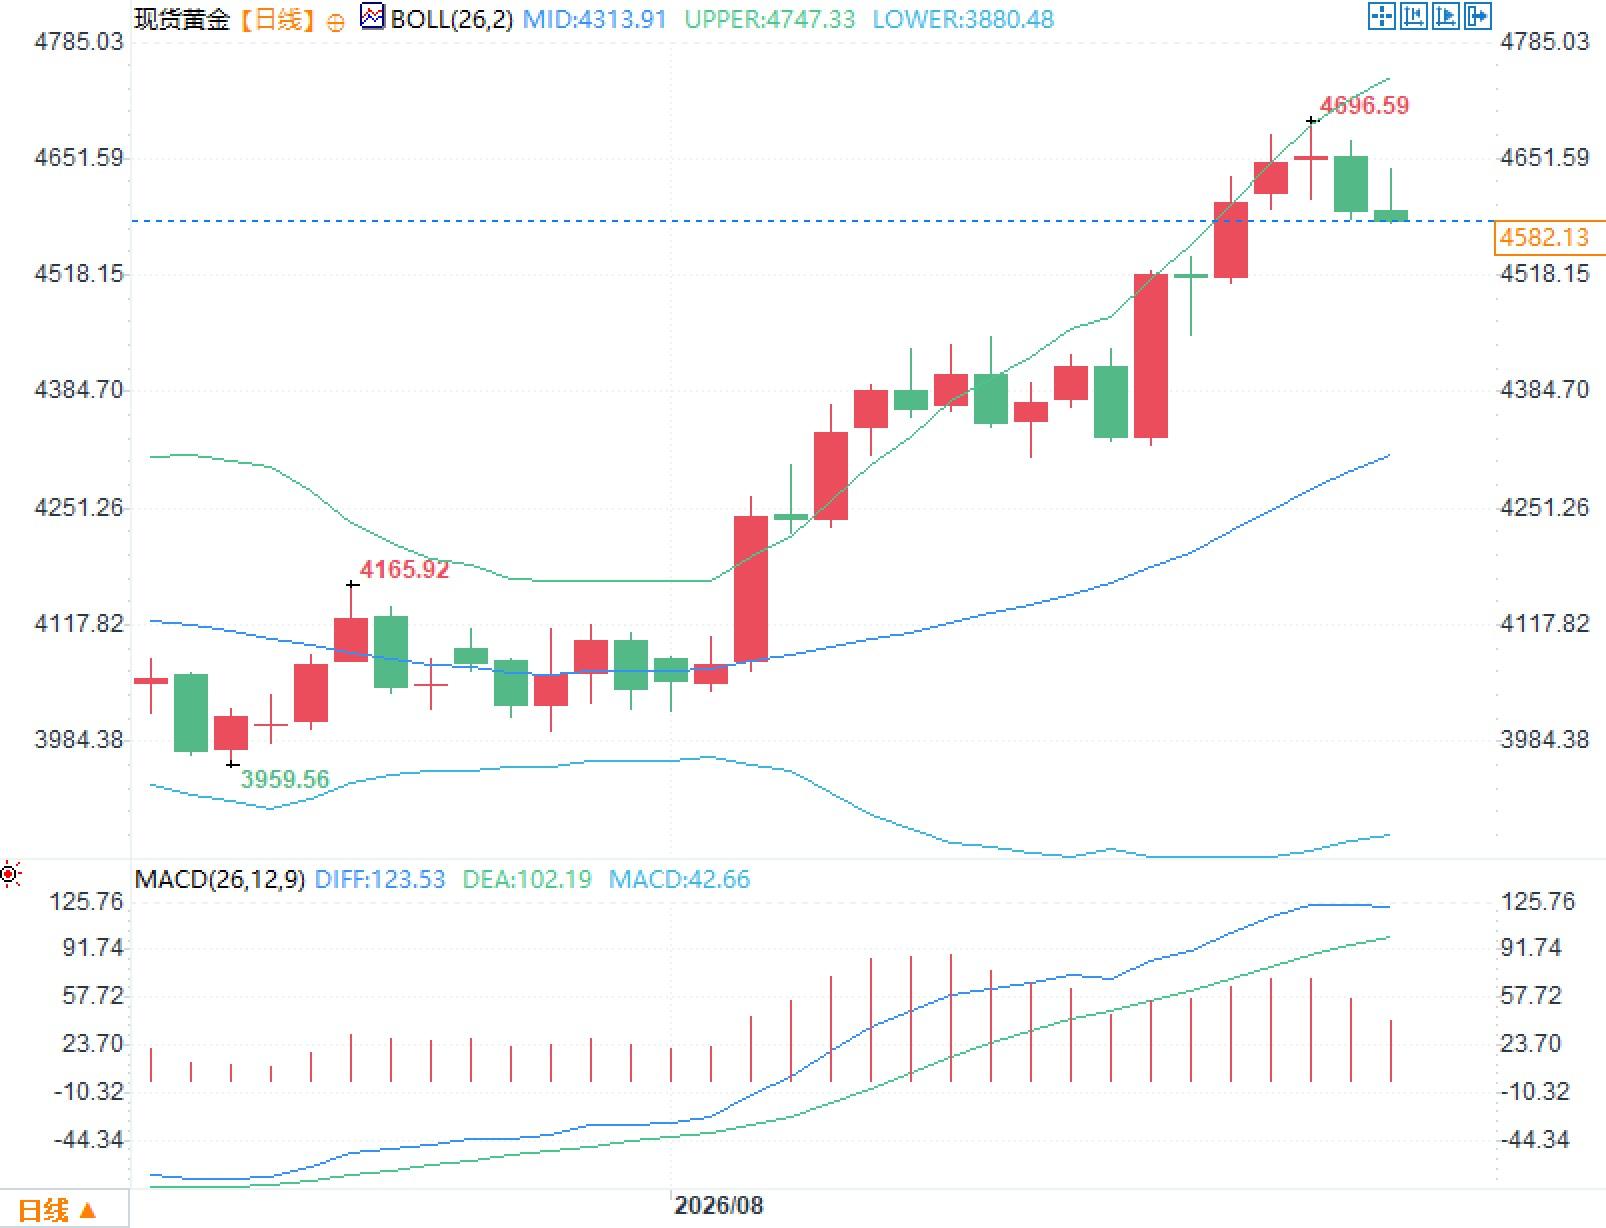 In terms of MACD, the DIFF is around 123.53 and the DEA is around 102.19, both still above the zero line, reflecting that the medium-term momentum has not yet broken away from the previous strong structure. However, the histogram has contracted compared to the previous high, indicating that the marginal upward momentum has weakened compared to the price acceleration phase.
The Federal Reserve's target range for the federal funds rate remains at 3.50% to 3.75%. With nominal policy rates unchanged and core inflation remaining high, the core variable truly influencing gold valuations remains real interest rate expectations. If the market believes inflation will persist for an extended period, and policy rates need to remain at restrictive levels for longer, the opportunity cost of non-interest-bearing assets will increase. Conversely, if the rise in long-term yields stems more from term premiums, fiscal financing pressures, and changes in bond supply and demand structures than from improved real growth expectations, the traditional negative correlation between gold and Treasury yields may weaken temporarily. This is a key market characteristic of the recent simultaneous high levels of both gold and long-term yields. It's crucial to distinguish whether the rise in nominal yields originates from real interest rates, inflation compensation, or term premiums, as these three sources have entirely different implications for gold valuations. The market is focused on Kevin Warsh's speech on August 28th, but the real focus is not on any isolated phrase, but rather on how the Fed assesses recent changes in financial conditions. At the July policy meeting, the Fed voted 9-3 to keep rates unchanged, with three members supporting a 25 basis point rate hike. This voting structure indicates that internal tolerance for inflation risks is not entirely consistent. Meanwhile, the market's pricing in a September policy adjustment is significantly lower than in previous periods, with the current probability of a rate hike roughly in the 30-40% range. Therefore, if Warsh's speech discusses the relationship between inflation persistence, long-term yields, asset prices, and financial conditions, its market implications may be greater than simply reiterating the 2% inflation target. Particular attention should be paid to whether the Fed believes that some recent financial conditions have become excessively loose, and whether this change will slow the pace of inflation returning to the target. Gold is currently effectively caught between two pricing frameworks. One is the constraint of higher inflation corresponding to a longer period of restrictive interest rates; the other is the asset allocation demand driven by concerns about debt supply, term premiums, and currency purchasing power. The simultaneous existence of these two logics is the reason for the significant amplification of recent price volatility at high levels. The US dollar index is currently hovering around 99, recovering somewhat from its previous lows, but it has not formed a completely synchronized strengthening relationship with high Treasury yields. This is particularly important for gold. Normally, a stronger dollar and rising real yields would simultaneously increase the cost of holding gold, but recent changes in the long-term Treasury market include a clear term premium factor. The yield on 10-year US Treasury bonds is currently around 4.65%, while the 30-year yield remains above 5%, indicating that long-term funds require higher compensation for inflation, bond supply, and term risk. Therefore, it's premature to mechanically conclude that precious metals are under pressure simply because yields are rising. If the rise in yields stems from improved expectations of actual economic growth, the constraint on gold valuations is usually more direct; if it mainly comes from a widening term premium and an imbalance between supply and demand for long-term bonds, gold may simultaneously attract asset allocation demand. Observing the daily chart, gold prices are still clearly trading above the Bollinger Band's middle band, and after a rapid rise, have entered a period of consolidation at high levels. The Bollinger Band's middle band continues to rise, and the upper band is also expanding upwards, indicating a significant upward shift in the previous price fluctuation center. However, the price has fluctuated after repeatedly approaching the upper band, which also means that short-term volatility and holding costs are being readjusted. In terms of MACD, the DIFF is around 123.53 and the DEA is around 102.19, both still above the zero line, reflecting that the medium-term momentum has not yet broken away from the previous strong structure. However, the histogram has contracted compared to the previous high, indicating that the marginal upward momentum has weakened compared to the price acceleration phase.
- Risk Warning and Disclaimer
- The market involves risk, and trading may not be suitable for all investors. This article is for reference only and does not constitute personal investment advice, nor does it take into account certain users’ specific investment objectives, financial situation, or other needs. Any investment decisions made based on this information are at your own risk.