Gold sellers trade on a weekly basis, while gold buyers plan their investments over decades.
2026-09-03 18:12:05
On Thursday (September 3), spot gold rebounded for the second consecutive day, rising nearly 1% intraday. This followed a drop of over 2% on Tuesday. The logic behind these two declines is not complicated: market expectations shifted from anticipating the Federal Reserve to maintaining interest rates to expecting a rate hike. Gold itself does not generate interest; when the opportunity cost of holding gold increases, its price comes under downward pressure. By Thursday, gold prices had recovered to around $4425.  A more worthwhile question to explore is: while official departments around the world continue to increase their gold holdings, who is selling gold? In summary, the market operates on two distinct rhythms, with two types of participants following drastically different time horizons: one type of trader trades based on interest rate expectations for the next two weeks; the other focuses on the next decade, managing the risks of reserve assets. Why did the Dutch Central Bank transfer 86 tons of gold to London? The Dutch Central Bank (DNB) transferred 86 tons of gold from its vaults in New York and Ottawa, a process completed in batches between March and August. This amount represents more than a quarter of the total gold held by the Dutch Central Bank in its North American vaults (approximately 313 tons). The proportion of Dutch gold held in New York decreased from 31.3% to 18.5%, and in Ottawa from 19.7% to 18.5%, while the proportion in London increased from 18.1% to 32.1%. Dutch Central Bank Governor Olaf Sleipen stated that this move was due to considerations of gold's tradability, not a bet on gold price fluctuations. He stated that the adjustment would allow the central bank to utilize these reserves more quickly. It's worth noting that the operational method and the tonnage transferred are equally important. The Dutch central bank physically transported approximately 27 tons of gold, with the remainder transferred through book-entry sales, eliminating the need to melt down and remelt the gold bars. If central banks continue to buy gold, who will be the sellers? Deutsche Bank concludes that the main sellers are commercial institutions and ordinary individual holders, not the trend-following funds commonly perceived. Daniel Galli, head of precious metals research at Deutsche Bank, wrote on Tuesday, September 1st, that the selling pressure in the spot market has largely been exhausted; Commodity Trading Advisors (CTAs) are the buyers absorbing the selling pressure, not the driving force behind this round of declines. He gave a clear critical price level: only a drop below approximately $4315 per ounce would trigger a new round of programmed selling; as long as it remains above this level, general price weakness will not lead to a stampede-like decline. Meanwhile, independent macro funds did not participate in the late summer gold price rally. This means that these funds are likely to become buyers in the next round, rather than sellers. From a price perspective, the closing low on Tuesday and the intraday low on Wednesday were both within 0.5% of the key level of $4,315. Are the judgments of major Wall Street trading seats truly consistent? Not at all; Wednesday presented a very typical example of a contrasting view. Hours after Deutsche Bank's research report circulated, TD Securities, using the same set of data, gave a completely opposite short-term assessment. Ryan McKay and Bart Melek believed that gold was approaching the CTA (Commodity Trading Advisor) programmatic selling threshold, around $4,300. Their model projections showed that the price of gold could fall to the $4,200-$4,100 range, and once it fell to this range, all programmatic positions would be liquidated. They also mentioned that market pricing already reflects the possibility that the Fed will raise interest rates more than twice in 2027. However, both institutions reached the same long-term conclusion: they both believe that gold does not have significant long-term downside potential because the logic of currency devaluation has re-emerged, and the Fed's interest rate hikes themselves remain highly uncertain. Incidentally, Gali previously worked in the precious metals trading department of TD Securities before being poached by Deutsche Bank in May of this year. The same professional background and the same set of market data have led to two drastically different judgments. What will happen to gold if the sellers' interest rate expectations are wrong? This week, the market has already seen two fluctuations in pricing in this assumption. Wednesday's ADP data showed that the US private sector added only 38,000 jobs in August, lower than the Dow Jones consensus forecast of 47,000, marking the lowest level of job growth since January; manufacturing jobs alone decreased by 17,000 (ADP). After the data release, gold prices reversed their intraday decline and rose. In addition, US Treasury Secretary Scott Bessant held talks with Bank of Japan Governor Kazuo Ueda. The US Treasury stated that the Secretary urged Japan to take "decisive measures" to curb the weakening of the yen. The essence of this matter: the US Treasury is publicly pressuring other central banks to tighten monetary policy, pushing up its own currency to counter the dollar. Background information: The Bank of Japan's interest rate meeting is scheduled for September 17-18, two days after the Federal Reserve meeting. The market has almost fully priced in a Japanese interest rate hike. The yield on 10-year Japanese government bonds has reached 3%, the first time since 1996. With the probability of a rate hike doubling, why did gold record its best monthly performance since January? Because the trading directions of two types of funds are completely opposite, with the longer-term side dominating the August market. Gold closed up 9.6% in August, its strongest monthly performance since January; silver rose about 15% during the same period. During the same period, influenced by Chairman Kevin Warsh's speech at the Jackson Hole Economic Symposium, data from the CME FedWatch Tool showed that the probability of a September rate hike climbed from about 36% to around 64%. The inflection point in real yields can explain the market movement: the yield on 10-year Treasury Inflation-Protected Securities (TIPS) bottomed out at 2.32% on August 25th (Tuesday), then rose to 2.44% on August 31st (Federal Reserve Economic Database). Gold prices peaked precisely that week, subsequently giving back some of their gains.
 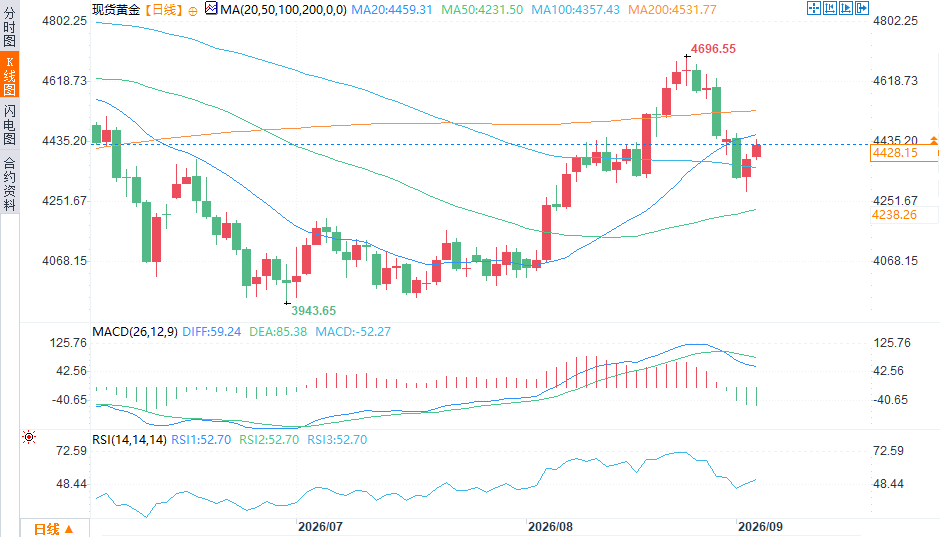 (Spot gold daily chart source: EasyTrade) UniCredit Bank of Italy raised its 2026 year-end gold price forecast range to $4,400–$5,200 on Wednesday. The bullish logic is based on three pillars: continued gold purchases by central banks, a steepening US Treasury yield curve, and inflows into gold ETFs. What should long-term gold holders glean from this week's market movements? Two types of participants have drastically different concerns: trend-following funds are concerned with gold price movements over the next three weeks; when real yields are at 2.44%, selling is a reasonable decision. Reserve managers are considering a different question: if the current monetary system fails, will gold, as a form of wealth preservation, still have value? Interest rates alone cannot answer this question. The Dutch central bank's transfer of 86 tons of gold was not to predict the outcome of the September Fed meeting; rather, it aimed to ensure rapid deployment in the event of an unpredictable crisis. World Gold Council data shows that central bank gold purchases in the second quarter reached a record high of 288.9 tons. The next two dates will test the bears' logic: the release of the August non-farm payroll data on September 4th (Friday); and the Federal Reserve's interest rate meeting on September 16th (Wednesday). While market positioning has changed this week, the long-term bullish logic for gold remains intact.
A more worthwhile question to explore is: while official departments around the world continue to increase their gold holdings, who is selling gold? In summary, the market operates on two distinct rhythms, with two types of participants following drastically different time horizons: one type of trader trades based on interest rate expectations for the next two weeks; the other focuses on the next decade, managing the risks of reserve assets. Why did the Dutch Central Bank transfer 86 tons of gold to London? The Dutch Central Bank (DNB) transferred 86 tons of gold from its vaults in New York and Ottawa, a process completed in batches between March and August. This amount represents more than a quarter of the total gold held by the Dutch Central Bank in its North American vaults (approximately 313 tons). The proportion of Dutch gold held in New York decreased from 31.3% to 18.5%, and in Ottawa from 19.7% to 18.5%, while the proportion in London increased from 18.1% to 32.1%. Dutch Central Bank Governor Olaf Sleipen stated that this move was due to considerations of gold's tradability, not a bet on gold price fluctuations. He stated that the adjustment would allow the central bank to utilize these reserves more quickly. It's worth noting that the operational method and the tonnage transferred are equally important. The Dutch central bank physically transported approximately 27 tons of gold, with the remainder transferred through book-entry sales, eliminating the need to melt down and remelt the gold bars. If central banks continue to buy gold, who will be the sellers? Deutsche Bank concludes that the main sellers are commercial institutions and ordinary individual holders, not the trend-following funds commonly perceived. Daniel Galli, head of precious metals research at Deutsche Bank, wrote on Tuesday, September 1st, that the selling pressure in the spot market has largely been exhausted; Commodity Trading Advisors (CTAs) are the buyers absorbing the selling pressure, not the driving force behind this round of declines. He gave a clear critical price level: only a drop below approximately $4315 per ounce would trigger a new round of programmed selling; as long as it remains above this level, general price weakness will not lead to a stampede-like decline. Meanwhile, independent macro funds did not participate in the late summer gold price rally. This means that these funds are likely to become buyers in the next round, rather than sellers. From a price perspective, the closing low on Tuesday and the intraday low on Wednesday were both within 0.5% of the key level of $4,315. Are the judgments of major Wall Street trading seats truly consistent? Not at all; Wednesday presented a very typical example of a contrasting view. Hours after Deutsche Bank's research report circulated, TD Securities, using the same set of data, gave a completely opposite short-term assessment. Ryan McKay and Bart Melek believed that gold was approaching the CTA (Commodity Trading Advisor) programmatic selling threshold, around $4,300. Their model projections showed that the price of gold could fall to the $4,200-$4,100 range, and once it fell to this range, all programmatic positions would be liquidated. They also mentioned that market pricing already reflects the possibility that the Fed will raise interest rates more than twice in 2027. However, both institutions reached the same long-term conclusion: they both believe that gold does not have significant long-term downside potential because the logic of currency devaluation has re-emerged, and the Fed's interest rate hikes themselves remain highly uncertain. Incidentally, Gali previously worked in the precious metals trading department of TD Securities before being poached by Deutsche Bank in May of this year. The same professional background and the same set of market data have led to two drastically different judgments. What will happen to gold if the sellers' interest rate expectations are wrong? This week, the market has already seen two fluctuations in pricing in this assumption. Wednesday's ADP data showed that the US private sector added only 38,000 jobs in August, lower than the Dow Jones consensus forecast of 47,000, marking the lowest level of job growth since January; manufacturing jobs alone decreased by 17,000 (ADP). After the data release, gold prices reversed their intraday decline and rose. In addition, US Treasury Secretary Scott Bessant held talks with Bank of Japan Governor Kazuo Ueda. The US Treasury stated that the Secretary urged Japan to take "decisive measures" to curb the weakening of the yen. The essence of this matter: the US Treasury is publicly pressuring other central banks to tighten monetary policy, pushing up its own currency to counter the dollar. Background information: The Bank of Japan's interest rate meeting is scheduled for September 17-18, two days after the Federal Reserve meeting. The market has almost fully priced in a Japanese interest rate hike. The yield on 10-year Japanese government bonds has reached 3%, the first time since 1996. With the probability of a rate hike doubling, why did gold record its best monthly performance since January? Because the trading directions of two types of funds are completely opposite, with the longer-term side dominating the August market. Gold closed up 9.6% in August, its strongest monthly performance since January; silver rose about 15% during the same period. During the same period, influenced by Chairman Kevin Warsh's speech at the Jackson Hole Economic Symposium, data from the CME FedWatch Tool showed that the probability of a September rate hike climbed from about 36% to around 64%. The inflection point in real yields can explain the market movement: the yield on 10-year Treasury Inflation-Protected Securities (TIPS) bottomed out at 2.32% on August 25th (Tuesday), then rose to 2.44% on August 31st (Federal Reserve Economic Database). Gold prices peaked precisely that week, subsequently giving back some of their gains. (Spot gold daily chart source: EasyTrade) UniCredit Bank of Italy raised its 2026 year-end gold price forecast range to $4,400–$5,200 on Wednesday. The bullish logic is based on three pillars: continued gold purchases by central banks, a steepening US Treasury yield curve, and inflows into gold ETFs. What should long-term gold holders glean from this week's market movements? Two types of participants have drastically different concerns: trend-following funds are concerned with gold price movements over the next three weeks; when real yields are at 2.44%, selling is a reasonable decision. Reserve managers are considering a different question: if the current monetary system fails, will gold, as a form of wealth preservation, still have value? Interest rates alone cannot answer this question. The Dutch central bank's transfer of 86 tons of gold was not to predict the outcome of the September Fed meeting; rather, it aimed to ensure rapid deployment in the event of an unpredictable crisis. World Gold Council data shows that central bank gold purchases in the second quarter reached a record high of 288.9 tons. The next two dates will test the bears' logic: the release of the August non-farm payroll data on September 4th (Friday); and the Federal Reserve's interest rate meeting on September 16th (Wednesday). While market positioning has changed this week, the long-term bullish logic for gold remains intact.
- Risk Warning and Disclaimer
- The market involves risk, and trading may not be suitable for all investors. This article is for reference only and does not constitute personal investment advice, nor does it take into account certain users’ specific investment objectives, financial situation, or other needs. Any investment decisions made based on this information are at your own risk.