With employment, oil prices, and inflation all exerting downward pressure, what signals are hidden around the $4400 mark for gold?
2026-09-07 17:50:05
On Monday, September 7th, the gold market entered a typical macroeconomic repricing window. Spot gold is currently fluctuating around $4400/ounce, continuing its decline from the previous trading day. The core trigger for this price adjustment is not simply a change in safe-haven sentiment, but rather a simultaneous reassessment of employment, interest rates, energy, and inflation expectations. US non-farm payrolls increased by 162,000 in August, significantly higher than the market's previous expectation of approximately 56,000, while the unemployment rate remained at 4.1%. Interest rate futures subsequently pushed back the probability of a 25 basis point rate hike by the Federal Reserve in September to approximately 58% to 60%. Meanwhile, Brent crude oil rose to nearly $97/barrel, with renewed shipping risks in the Middle East increasing energy inflation pressures. 
 Regarding the MACD, the DIFF is approximately 47.24, the DEA is approximately 73.47, and the histogram is approximately -52.45. The DIFF being lower than the DEA indicates a significant weakening of short-term momentum compared to previous highs. However, both indicator lines remain above the zero line, reflecting the simultaneous existence of medium-term trend inertia and short-term cooling. The US Treasury market was again affected by the holiday closure on September 7th, lacking new yield price discovery. The relative volatility among gold, forex, and crude oil may be more susceptible to liquidity influences. Therefore, the truly valuable information this week is not a single daily chart pattern, but rather whether the correlation between gold, short-term Treasury yields, the US dollar index, and crude oil changes after the inflation data release.
Gold is truly facing a restructuring of interest rate pricing.
The cross-asset reaction following the release of the US jobs report was very clear. The yield on the 2-year US Treasury note rose to 4.37%, and the yield on the 10-year note rose to 4.78%. The magnitude of the adjustment in short-term yields is particularly noteworthy, as they are more sensitive to the policy path of the next few Federal Reserve meetings. For gold, the more critical variable is the opportunity cost of holding non-interest-bearing assets. When jobs data reduces the urgency of a rapidly weakening economy, while inflation remains above the Fed's target, the market will increase its pricing for higher policy rates and higher real interest rates. This mechanism can explain a seemingly paradoxical phenomenon: escalating regional conflicts usually increase the demand for gold as a risk hedge, but if the same event simultaneously pushes up energy prices and inflation risks, and prompts the market to re-priced in interest rate hikes, the interest rate channel may completely override the traditional safe-haven channel in stages. Therefore, the core of current gold pricing is not "whether the risk has increased," but rather which asset pricing chain the risk is transmitted through. If the risk is mainly manifested in financial system uncertainty, gold's hedging properties are likely to dominate; if the risk is primarily manifested in rising oil prices, sticky inflation, and rising policy rates, then the constraints faced by the valuation of non-interest-bearing assets will be significantly strengthened.Crude oil is nearing $97, and the logic of safe-haven demand is being reinterpreted by the logic of inflation.
Brent crude oil rose to approximately $97 per barrel on September 7, with a cumulative increase of nearly 8% last week. Over the past 10 days, the average daily passage of commodity vessels through the Strait of Hormuz has been around 10, falling to its lowest level since May. This waterway has long carried a significant proportion of global energy transport; once its efficiency declines, the market often first accounts for not the actual scale of supply disruptions, but rather the overall premium for transport insurance, freight rates, inventory safety margins, and long-term supply risks. This is particularly important for gold. Traditional models often simply equate regional conflicts with increased demand for gold as a safe haven, but in the current macroeconomic environment, rising energy prices also affect consumer inflation, business input costs, and inflation expectations. In other words, the same risk factor can simultaneously increase the demand for gold as an asset allocation while weakening its relative valuation attractiveness by raising bond yields. This is why the Producer Price Index (PPI) and Consumer Price Index (CPI) are significantly more important this week than usual data release weeks. The US August PPI will be released on September 10, and the CPI on September 11, while the Federal Reserve policy meeting is scheduled for September 15-16. Employment, energy, and inflation data will be continuously incorporated into policy models in a very short period of time, which may cause the market's probability distribution of interest rate paths to change rapidly.Despite the headwinds of short-term interest rates, gold still faces independent structural demand.
Looking solely at interest rates can easily underestimate the structural changes in the gold market in recent years. Latest statistics show that global official sectors made net purchases of approximately 23 tons of gold in July; net purchases in the second quarter reached approximately 289 tons, a significant rebound from the first quarter, with cumulative net demand for the first half of the year at approximately 345 tons. Another survey indicates that 89% of surveyed reserve management institutions expect global central bank gold reserves to continue increasing over the next 12 months, and 45% expect their own gold allocations to rise. This type of demand is fundamentally different from short-term macroeconomic trading funds. Interest rate-driven funds are highly focused on the next one or two policy meetings, while reserve allocation prioritizes asset diversification, liquidity, long-term purchasing power, and asset independence in extreme scenarios. Therefore, gold prices may simultaneously face two sets of funding logics with different time scales: short-term pricing is rapidly driven by interest rates, the US dollar, and real yields, while medium- to long-term pricing is influenced by official reserves, institutional allocations, and adjustments to risk budgets. This funding structure also explains why gold's high volatility has persisted this year. Rapid price adjustments do not necessarily mean the disappearance of long-term allocation logic; similarly, the existence of long-term allocation demand does not mean that short-term prices can deviate from the interest rate environment. What really needs to be distinguished is the type of funds that marginal price setters come from, rather than attributing all price changes to a single "safe haven" label.The daily technical structure indicates a cooling of momentum.
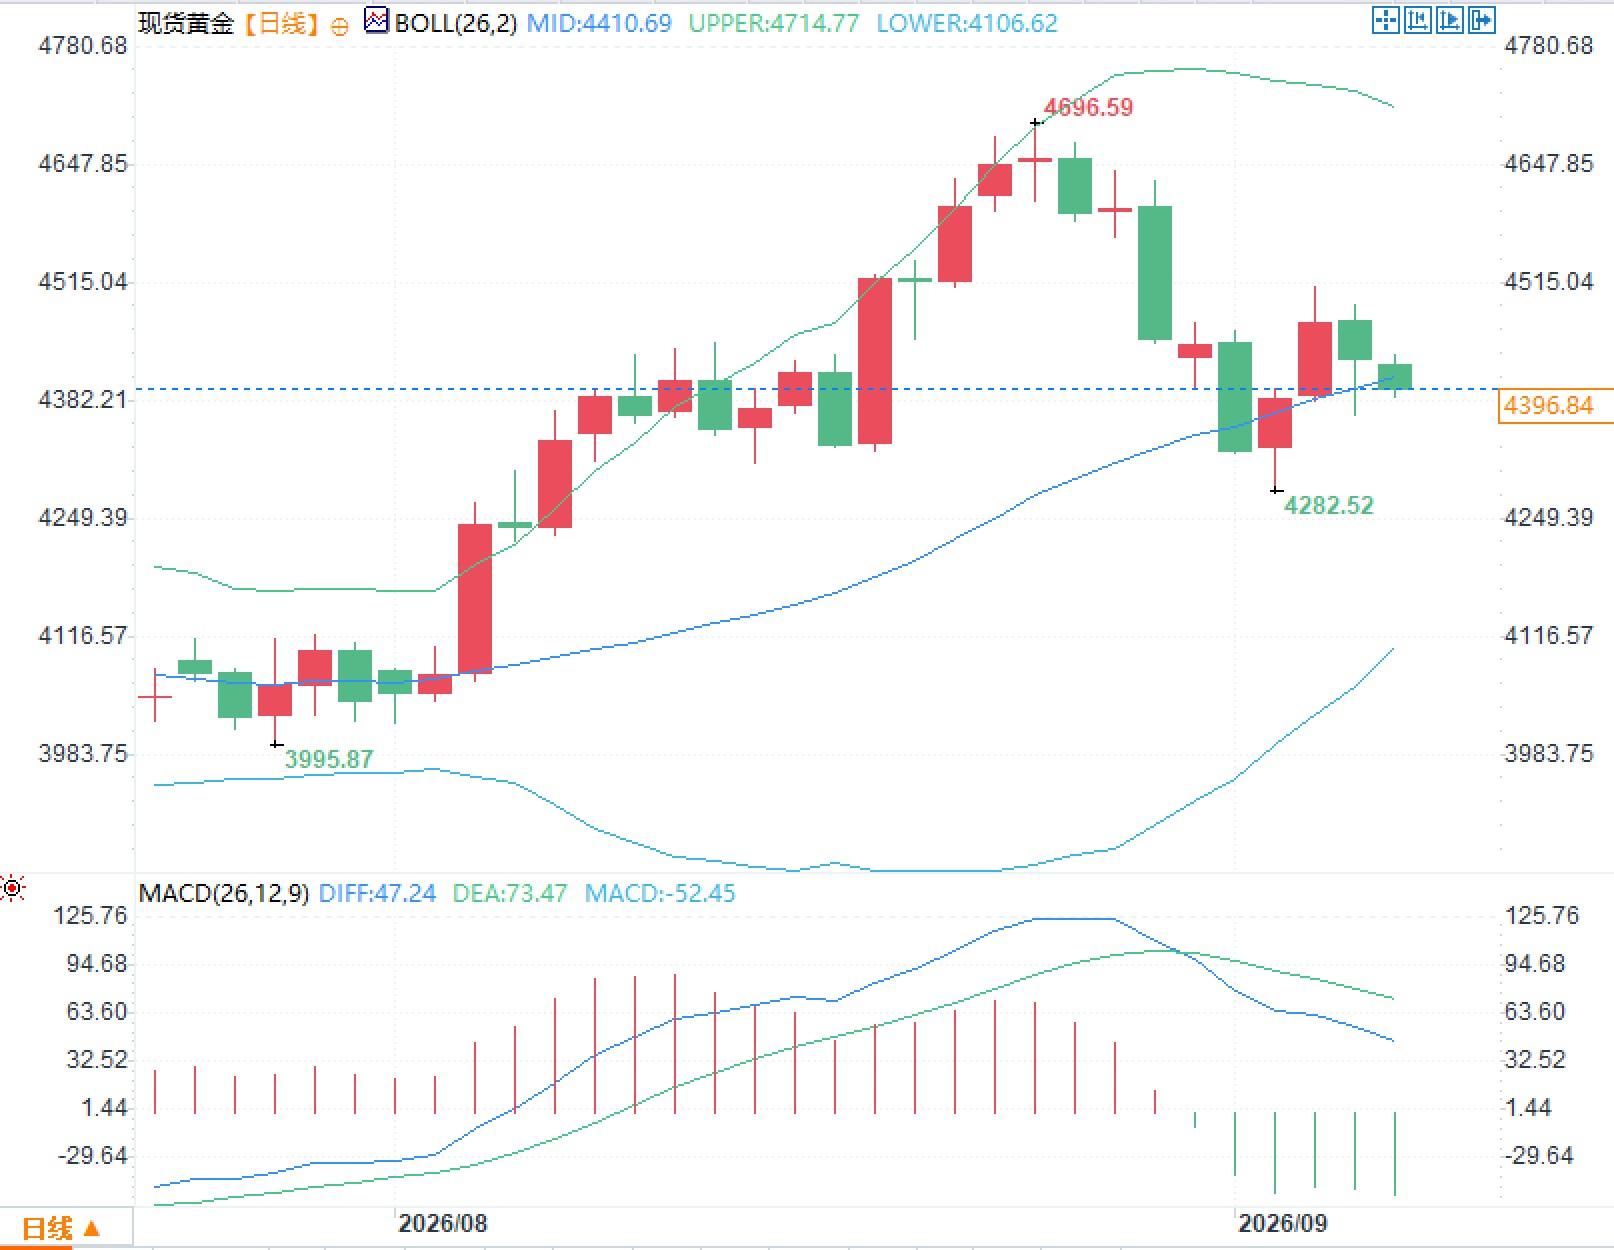
From the daily chart, the Bollinger Band middle line is around 4410.69, and the price has returned to this level. A significant gap remains between the upper and lower bands. This suggests that the high volatility left by the previous price expansion has not been fully digested, and the current situation is more a combination of volatility convergence and a period of waiting for macroeconomic events. Regarding the MACD, the DIFF is approximately 47.24, the DEA is approximately 73.47, and the histogram is approximately -52.45. The DIFF being lower than the DEA indicates a significant weakening of short-term momentum compared to previous highs. However, both indicator lines remain above the zero line, reflecting the simultaneous existence of medium-term trend inertia and short-term cooling. The US Treasury market was again affected by the holiday closure on September 7th, lacking new yield price discovery. The relative volatility among gold, forex, and crude oil may be more susceptible to liquidity influences. Therefore, the truly valuable information this week is not a single daily chart pattern, but rather whether the correlation between gold, short-term Treasury yields, the US dollar index, and crude oil changes after the inflation data release.Frequently Asked Questions
Question 1: Why hasn't gold exhibited its traditional safe-haven characteristics despite escalating regional conflicts? Answer: Because the current conflicts primarily impact energy transportation and oil prices. Rising oil prices increase inflation risk, leading the market to re-priced in the probability of a Fed rate hike and higher bond yields. Gold is simultaneously influenced by both safe-haven demand and the rising opportunity cost of non-interest-bearing assets; therefore, a single safe-haven model cannot explain short-term prices. Question 2: Why are the Producer Price Index (PPI) and Consumer Price Index (CPI) particularly crucial this week? Answer: Employment data has significantly altered market expectations for the September policy meeting, while inflation data is only a few trading days away from the Fed meeting. If price pressures remain sticky, the market needs to recalibrate the policy rate path; if inflationary pressures ease, the tightening pricing previously established by employment data will also need to be revised.- Risk Warning and Disclaimer
- The market involves risk, and trading may not be suitable for all investors. This article is for reference only and does not constitute personal investment advice, nor does it take into account certain users’ specific investment objectives, financial situation, or other needs. Any investment decisions made based on this information are at your own risk.