The British pound has been fluctuating around the 1.35 level against the US dollar. Technically, the overall trend is bullish, but fundamental factors are limiting the upside potential.
2026-09-08 14:08:10
The foreign exchange market is experiencing a complex interplay of factors, including the strength of the US dollar, geopolitical tensions, and key economic data, resulting in a stalemate for the British pound against the US dollar recently. On Tuesday in Asian trading, the pound failed to capitalize on the previous day's slight gains, fluctuating below 1.3550. On one hand, a stronger yen is putting downward pressure on the dollar, limiting the pound's downside; on the other hand, rising expectations of a Fed rate hike and escalating tensions between the US and Iran are supporting the dollar. With the UK's monthly GDP and the US inflation report due, traders are generally cautious, and a clear winner is yet to emerge. 
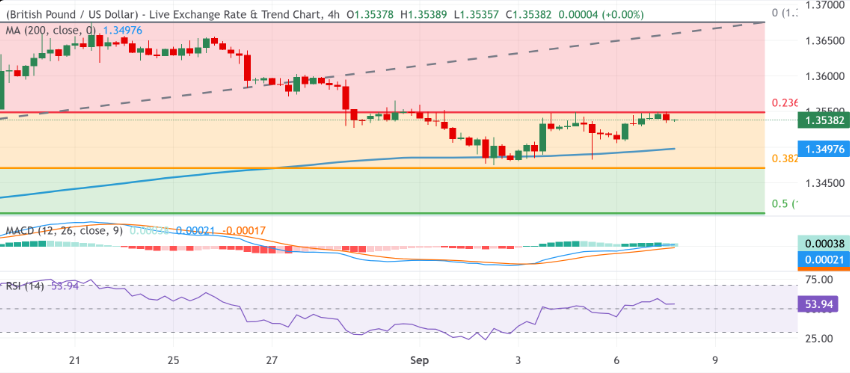 Chart: GBP/USD 4-hour chart
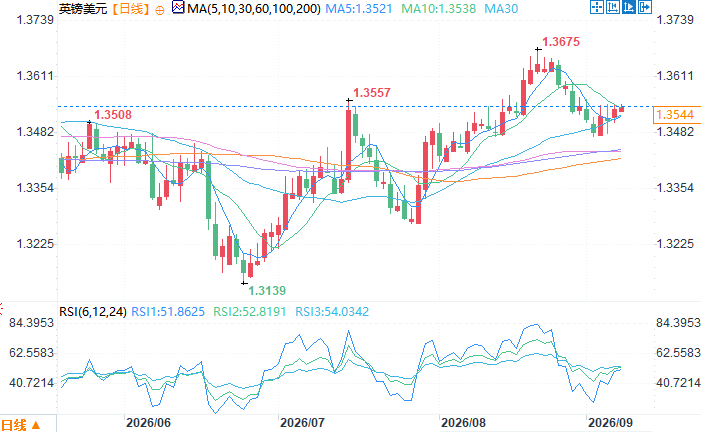 GBP/USD Daily Chart Source: FX678 At 14:00 Beijing time on September 8th, GBP/USD was trading at 1.3544/45.
A complex interplay of fundamental factors, with two main forces influencing the GBP/USD exchange rate.
The current oscillating pattern of the pound against the dollar is essentially a result of two completely opposite driving forces balancing each other. The core factor supporting the pound comes from the yen; the overall strengthening of the yen has led to continuous selling of the dollar, putting pressure on the dollar index and indirectly creating a buffer for the pound against the dollar, preventing a complete breakdown in the exchange rate. However, factors hindering further gains in the pound cannot be ignored. Market expectations for the Federal Reserve to restart interest rate hikes are constantly strengthening, coupled with geopolitical uncertainties brought about by the escalating US-Iran tensions, leading to increased demand for the dollar as a safe haven. This creates a tailwind supporting the dollar, directly suppressing the pound's rebound in the dollar. In addition, the market is awaiting the release of a series of key economic indicators, and traders are unwilling to pre-emptively bet on the direction. This week, the UK's monthly GDP data will be released, and the latest US inflation data will also be released. These two sets of data are related to the current state of the UK economy and the Fed's future monetary policy path, respectively. Before the data is released, market sentiment is cautious, and the willingness to actively trade has decreased, causing the exchange rate to oscillate within a range. Chart: GBP/USD 4-hour chartTechnical Analysis: Overall trend is bullish, but upward momentum has not yet been fully released.
From a 4-hour chart perspective, the GBP/USD pair has stabilized above the 200-period Simple Moving Average (SMA), maintaining a mild bullish bias. The current spot price is trading above a dense Fibonacci support zone, with the 38.2% Fibonacci retracement level of the June-August rally at 1.3471 as its core. Supporting indicators also suggest a neutral-to-bullish signal: the MACD remains slightly positive, and the RSI hovers around 54. These indicators collectively suggest that the pair has the basic conditions for upward movement; however, the bullish momentum has not yet reached a strong breakout stage and does not support a rapid, one-sided surge. The first key resistance level is at the 23.6% Fibonacci retracement level of 1.3549, not far above the current price. Only if the pair can firmly establish itself above this resistance can it open up more room for a larger correction, propelling the GBP/USD pair to continue its rebound within a larger range.Key price levels analyzed, supporting tiered distribution.
If the bulls' attempt to break through is thwarted, the market will need to focus on the progressively stronger support levels below. The first layer of support comes from the 200-period simple moving average on the 4-hour chart, at 1.3498; immediately following is the previously mentioned 38.2% Fibonacci retracement level at 1.3471. If the bears strengthen and the price breaks below these two support levels, deeper support levels will emerge. The 50.0% retracement level at 1.3408 will likely absorb the first wave of selling pressure, and if the selling pressure continues to intensify, the 61.8% retracement level at 1.3344 will become the next important bottom support. These technical range boundaries will be crucial references for price breakouts after the data release.Conclusion
In summary, the GBP/USD pair is currently in a typical data-driven consolidation phase. Fundamentally, a stronger yen is supporting the dollar, while expectations of a Fed rate hike and geopolitical risks between the US and Iran are limiting any rebound, resulting in a roughly balanced market. Technically, while maintaining a mildly bullish bias, upward momentum is limited. The key short-term trading range is defined by resistance at 1.3549 and support at 1.3471. Subsequent UK GDP and US inflation data could very well be the catalyst for breaking the current consolidation pattern. Investors should closely monitor for a decisive breakout and avoid blindly betting on a one-sided trend within the current range. GBP/USD Daily Chart Source: FX678 At 14:00 Beijing time on September 8th, GBP/USD was trading at 1.3544/45.
- Risk Warning and Disclaimer
- The market involves risk, and trading may not be suitable for all investors. This article is for reference only and does not constitute personal investment advice, nor does it take into account certain users’ specific investment objectives, financial situation, or other needs. Any investment decisions made based on this information are at your own risk.