Brent crude oil breaks $100: Two Middle East supply lines catch fire simultaneously
2026-09-09 16:18:06
On Wednesday, September 9th, Brent crude futures broke through the $100/barrel mark. US crude also strengthened, priced at around $94. The market rally was not driven by a single inventory report, but by the simultaneous escalation of two supply disruptions in the Middle East: clashes between Houthi rebels in Yemen and Saudi Arabia, with Saudi Arabia reporting approximately 73 injuries, fires at some energy facilities leading to temporary shutdowns, and the Jizan refinery having a designed capacity of approximately 400,000 barrels per day; and on the same day, US forces struck five Iranian oil tankers near Kharg Island and in the Gulf of Oman. The market interpreted these two news items as a repricing of the channel risk premium. IING Group believes that with Brent crude near $100, the regional situation necessitates the market still factoring in a substantial risk premium. 
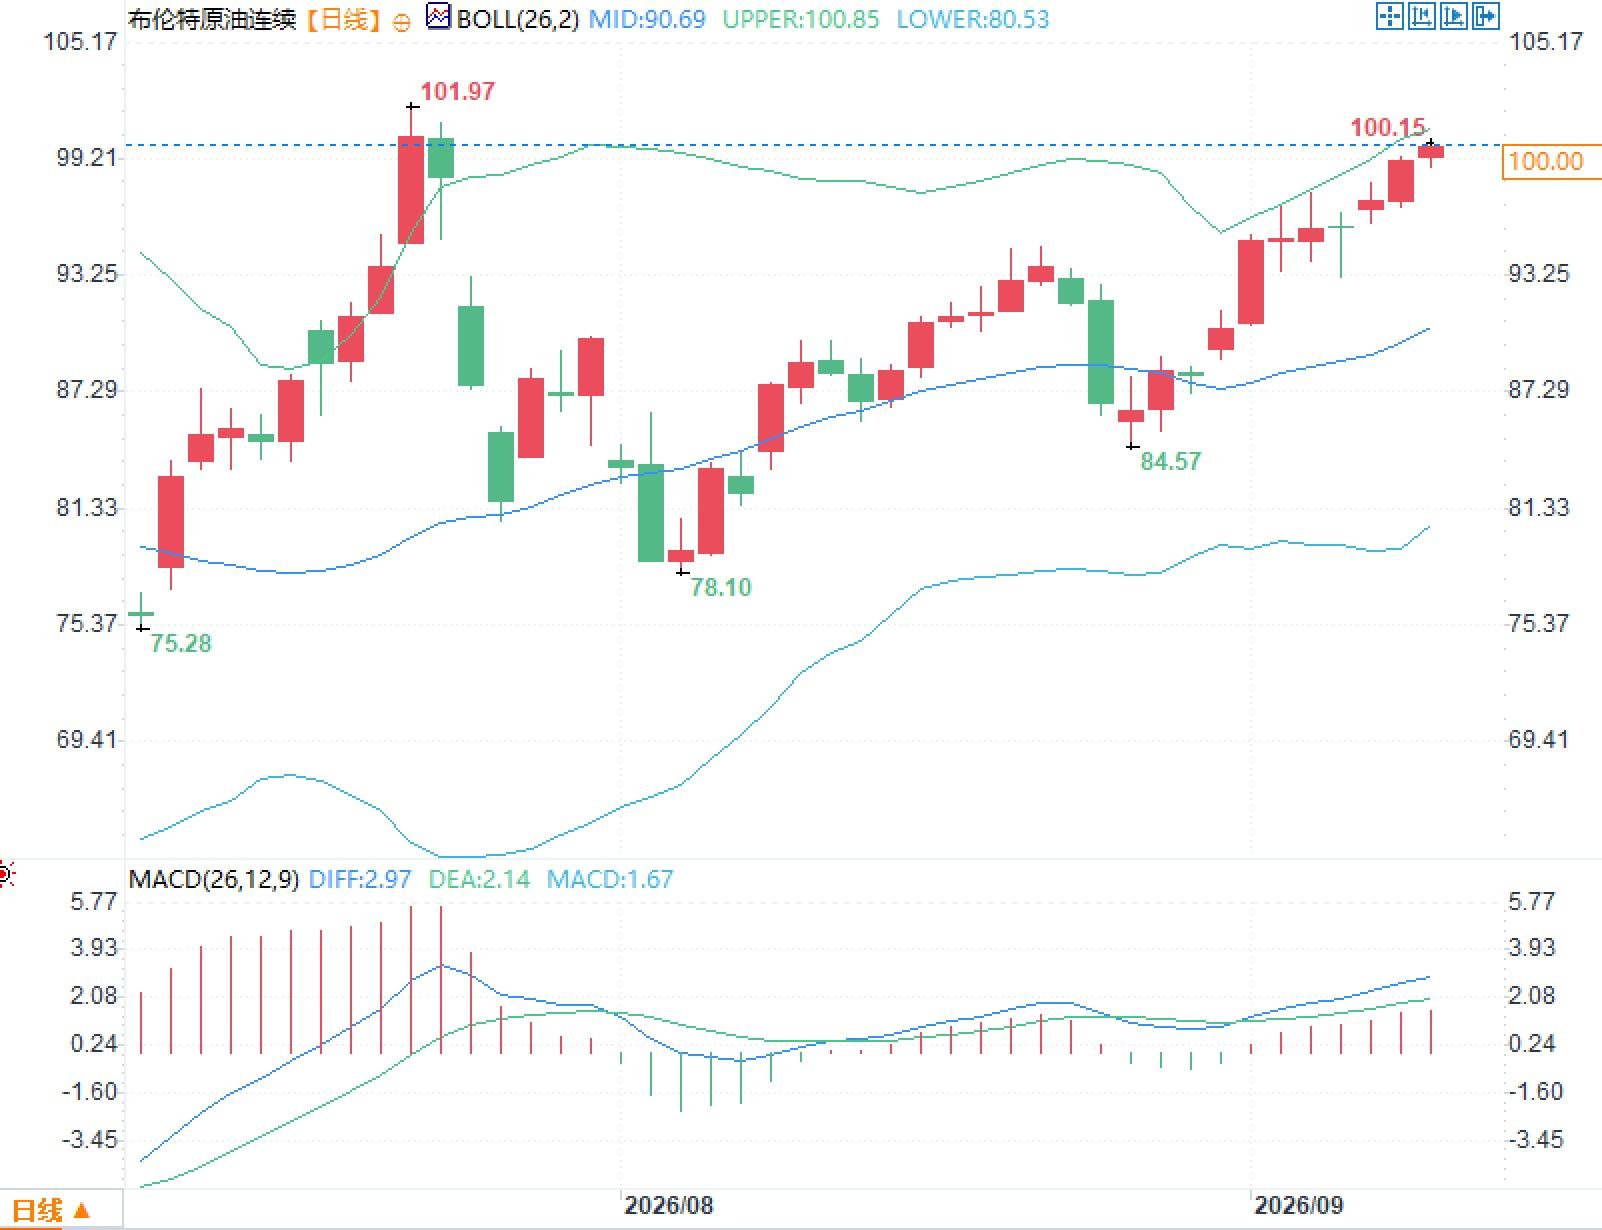 Even more informative is the volatility status: the Bollinger Bands are widening and the MACD histogram has remained positive after turning from negative to positive, indicating that pricing power has recently been more driven by events than by mean reversion.
Physical Flow Flows: Rebalancing of Hormuz Flows and Alternative Exports
The Strait of Hormuz remains a key factor in pricing. Before the conflict, the combined flow of crude oil and refined products through this waterway was around 20 million barrels per day. After the conflict, the flow dropped sharply. Although it briefly rebounded in the middle of the year, the density of ships passing through the strait declined again after hostilities resumed in August and September. Analysis shows that in the past ten days, an average of about 10 commercial vessels have passed through the strait daily, a low level since May. Some crude oil from Gulf oil-producing countries has been diverted to Saudi Arabia's east-west pipeline, transported via the port of Yanbu on the Red Sea, to bypass the blocked waterway. The Houthi attacks, targeting a southern energy hub, have effectively included the Red Sea export side, originally used to hedge against Hormuz risks, in the disruption list. OPEC's preliminary survey estimates for August production indicate a decrease of approximately 900,000 barrels per day month-on-month, to 19.91 million barrels per day, with Saudi Arabia's reduction being the largest, consistent with the regional escalation in August. OPEC and some of the core G7 oil-producing countries recently decided to maintain the expected production levels for October, without making a symbolic increase. The decision itself has a limited impact on paper prices, as "quota increases or decreases" are unlikely to immediately translate into increases or decreases in shipments when shipping routes are blocked. The International Energy Agency has previously considered this round of Middle East supply shocks as one of the largest disruptions in the modern oil market, noting that OECD commercial inventories had fallen to multi-decade lows, and the release of strategic reserves has narrowed the buffer. The physical market is more sensitive to middle distillates such as diesel and jet fuel: the combined effect of refinery operations and rerouting routes often leads to product-side tightness before it is reflected in crude oil paper prices. Energy Factors Consulting recently stated that diesel and gasoline prices are already high, and the discount of crude oil relative to these products is narrowing.Structural observations near integer thresholds
From a daily chart perspective, Brent crude has rebounded from its August lows and is now trading near the upper Bollinger Band. The middle band is around $90.69, the upper band around $100.85, and the lower band around $80.53. The current price is close to the area where the upper band coincides with the $100 level. A previous high of around $101.97 was reached in July, and the current high is around $100.15. The MACD shows a DIFF of approximately 2.97, a DEA of approximately 2.14, and a histogram of approximately 1.67, with the fast and slow lines above the zero line. Even more informative is the volatility status: the Bollinger Bands are widening and the MACD histogram has remained positive after turning from negative to positive, indicating that pricing power has recently been more driven by events than by mean reversion.Policy and Macroeconomic Constraints: Inflation Transmission Precedes Paper Currency Narrative
The transmission of energy prices to inflation is now on the agenda of major central banks. The European Central Bank is about to hold an interest rate meeting, and the lagged effects of energy and freight rates on core commodity prices are one of the key points of discussion. High oil prices enter the producer price index through diesel, chemical raw materials, and shipping costs, and then spread to the consumer end. This chain does not necessarily correspond to whether a certain integer is broken, but it determines how long the volatility of paper prices can be sustained. The Bank of Canada, the Bank of England, and the Reserve Bank of Australia are also observing the impact of energy prices on inflation expectations. Supply-side hedging comes from increased production in the Americas and the use of strategic reserves, but these replace "landed quantities," not "immediately available shipment quantities." When the target expands from military facilities to tankers and refineries, the market prices shipping uncertainty, not the balance difference on the annual supply and demand table. The Royal Bank of Canada recently emphasized that its systemic inventory buffer is nearing its limit, and if shipping restrictions tighten again, the existing safety cushion will be depleted more quickly. For traders, this means that volatility premiums may be more stable than direction: as long as there is a high volume of channel news, implied volatility and inter-month premiums will be repeatedly driven up.Frequently Asked Questions
Question 1: Does Brent crude oil near $100 mean that supply has been substantially disrupted? Answer: Prices near round numbers reflect a revaluation of channel risks. While temporary shutdowns of facilities in southern Saudi Arabia and US strikes affecting tankers near Kharg Island have occurred, global arrivals are still being partially filled by alternative pipelines, supplies from the Americas, and inventory releases. Prices near $100 indicate the market is paying for "uncertainty of duration," not that daily shipping has completely stopped. Question 2: How should pricing weights be differentiated when news emerges from the Hormuz and Red Sea incidents simultaneously? Answer: The Hormuz incident determines whether ships loaded in the Gulf can enter the main Indian Ocean shipping lanes, while the Red Sea incident determines Saudi Arabia's westward exports and the flow of refined oil products to Eurasia. The Houthi strikes, which landed in southern nodes like Jizan, have disrupted alternative routes originally used to hedge against Strait risks. When both routes escalate simultaneously, freight rates, shipping schedules, and insurance rates often react faster than spot premiums.- Risk Warning and Disclaimer
- The market involves risk, and trading may not be suitable for all investors. This article is for reference only and does not constitute personal investment advice, nor does it take into account certain users’ specific investment objectives, financial situation, or other needs. Any investment decisions made based on this information are at your own risk.