A stalemate between bulls and bears continues! Gold is consolidating at high levels, awaiting a breakout from inflation data.
2026-09-09 18:50:11
Gold is currently trapped in a clear range-bound trading pattern. Whether it's professional gold traders or algorithmic trading programs that hold significant market weight, both are currently in a state of indecision between bulls and bears. Market trading logics are significantly divergent, with multiple game-theories balancing each other, and no single side currently dominating the short-term market. This has resulted in gold prices oscillating narrowly around $4400/ounce for an extended period, with a high degree of equilibrium between bulls and bears, preventing a clear one-sided trend from emerging.  The core headwinds currently facing gold prices stem from rising expectations of interest rate hikes and continuously increasing US Treasury yields. Gold is a zero-interest asset, offering no interest income. Rising yields and heightened interest rate hike expectations directly increase the opportunity cost of holding gold, exerting sustained downward pressure on prices. The core hedging logic: a weakening dollar + safe-haven demand supports gold prices. Despite these negative factors, gold prices haven't fallen sharply because two major positive factors have acted as a counterbalancing force. A continuously weakening dollar provides solid support for gold prices, effectively offsetting the bearish pressure from high yields and interest rate hike expectations. Simultaneously, medium- to long-term demand for gold remains resilient. Neither ETF holdings nor physical trading demand in the futures market has shown significant decline, indicating stable long-term investment intentions. Global geopolitical risks remain high, with the situation in the Middle East escalating again recently. The uncertainty of regional conflicts has fueled risk aversion in global markets. As a high-quality asset hedging tool, gold's allocation value is further highlighted, effectively locking in the downside potential of gold prices. From a data perspective, the Bloomberg Dollar Index has fallen by 1.25% over the past month. The core reason for the weakening dollar is the collective strengthening of major Asian currencies, with the Korean won, Japanese yen, and Australian dollar showing particularly strong appreciation, directly dragging down the dollar index and indirectly benefiting gold prices. Market Catalyst: Inflation Data Will Dominate the September Fed Decision Currently, the uncertainty surrounding the September FOMC interest rate decision is extremely high. Market pricing in Fed policy is highly volatile, with expectations of maintaining the current interest rate or a slight rate hike nearly evenly split, and no unified consensus yet formed. The upcoming August CPI and PPI data, two key inflation indicators, will be crucial in breaking the current stalemate, directly guiding the short-term direction of gold prices and setting the tone for the September policy meeting. If inflation data exceeds expectations and shows a rigid upward trend, market expectations for a rate hike will be further strengthened, US Treasury yields will remain high, and the probability of gold prices facing downward pressure will increase significantly. If inflation data cools less than expected, the current hawkish market pricing will be quickly corrected. This round of rate hikes will be temporarily closed, and the Fed's policy adjustment will most likely be postponed until after the US midterm elections in November. Technical Analysis: Key Support and Resistance Levels are Clear and Defined
 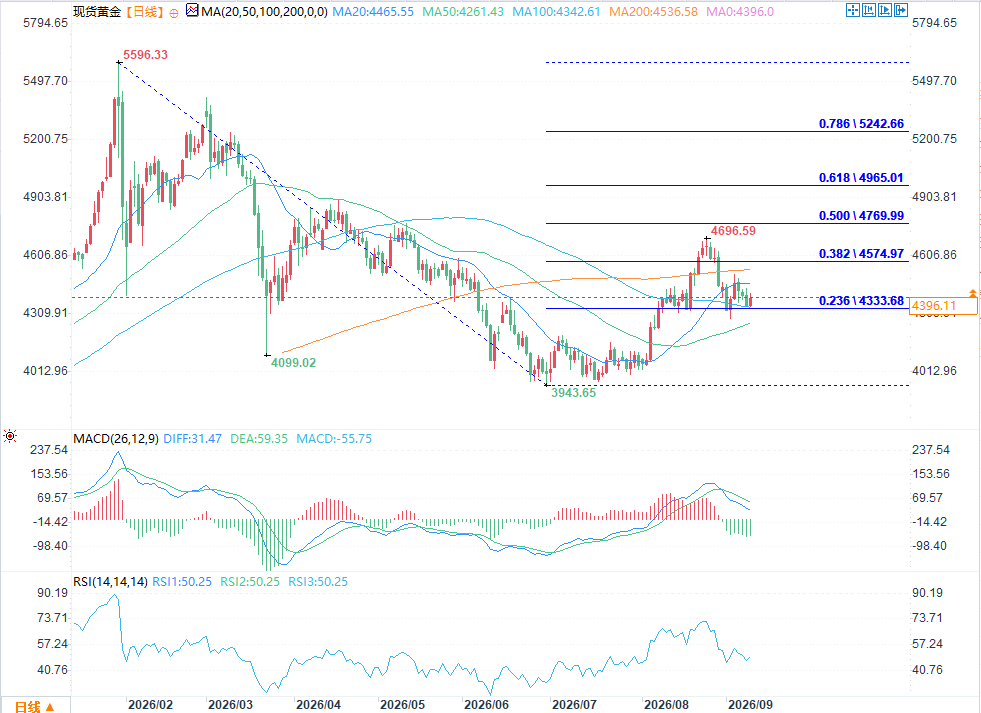 (Spot Gold Daily Chart Source: FX678) After completing a phase of rebound and recovery in August, gold has completely broken free from its previous weak adjustment pattern. Currently, the gold price is trading within a wide range of 200 USD, with $4400 as the central point. The market is stable and the fluctuations are regular. The core resistance level is the 200-day moving average, corresponding to a price of $4537, which is also a key watershed between the medium- and long-term bullish and bearish trends. The core support level is the $4350 range. This level has repeatedly acted as a support level during pullbacks over the past month, providing stable stabilization and serving as a key bottoming line for short-term gold prices. Bearish Scenario: The market is gradually forming a head and shoulders reversal pattern, a typical bearish signal. If the pattern is fully formed and the gold price effectively breaks below the key $4300 level, the short-term support system will be completely breached. The market will then begin a deep correction, with the medium- to long-term downside target at the core support level of $4000. Bullish Scenario: If gold prices stabilize above the upper limit of the current trading range and successfully break through the 200-day moving average resistance, the technical structure will be fully repaired, and the bullish trend will be officially established. The core upward target is $4770. This price level is both the high point in May of this year and the 50% Fibonacci retracement level of the sharp decline in the first half of the year, making it a highly valuable technical indicator. Risk Warning Historical price movements and market patterns cannot completely predict future market movements and returns. All trading operations involve risk. Strict control of position size and timing is essential during the investment process, along with prudent decision-making.
The core headwinds currently facing gold prices stem from rising expectations of interest rate hikes and continuously increasing US Treasury yields. Gold is a zero-interest asset, offering no interest income. Rising yields and heightened interest rate hike expectations directly increase the opportunity cost of holding gold, exerting sustained downward pressure on prices. The core hedging logic: a weakening dollar + safe-haven demand supports gold prices. Despite these negative factors, gold prices haven't fallen sharply because two major positive factors have acted as a counterbalancing force. A continuously weakening dollar provides solid support for gold prices, effectively offsetting the bearish pressure from high yields and interest rate hike expectations. Simultaneously, medium- to long-term demand for gold remains resilient. Neither ETF holdings nor physical trading demand in the futures market has shown significant decline, indicating stable long-term investment intentions. Global geopolitical risks remain high, with the situation in the Middle East escalating again recently. The uncertainty of regional conflicts has fueled risk aversion in global markets. As a high-quality asset hedging tool, gold's allocation value is further highlighted, effectively locking in the downside potential of gold prices. From a data perspective, the Bloomberg Dollar Index has fallen by 1.25% over the past month. The core reason for the weakening dollar is the collective strengthening of major Asian currencies, with the Korean won, Japanese yen, and Australian dollar showing particularly strong appreciation, directly dragging down the dollar index and indirectly benefiting gold prices. Market Catalyst: Inflation Data Will Dominate the September Fed Decision Currently, the uncertainty surrounding the September FOMC interest rate decision is extremely high. Market pricing in Fed policy is highly volatile, with expectations of maintaining the current interest rate or a slight rate hike nearly evenly split, and no unified consensus yet formed. The upcoming August CPI and PPI data, two key inflation indicators, will be crucial in breaking the current stalemate, directly guiding the short-term direction of gold prices and setting the tone for the September policy meeting. If inflation data exceeds expectations and shows a rigid upward trend, market expectations for a rate hike will be further strengthened, US Treasury yields will remain high, and the probability of gold prices facing downward pressure will increase significantly. If inflation data cools less than expected, the current hawkish market pricing will be quickly corrected. This round of rate hikes will be temporarily closed, and the Fed's policy adjustment will most likely be postponed until after the US midterm elections in November. Technical Analysis: Key Support and Resistance Levels are Clear and Defined (Spot Gold Daily Chart Source: FX678) After completing a phase of rebound and recovery in August, gold has completely broken free from its previous weak adjustment pattern. Currently, the gold price is trading within a wide range of 200 USD, with $4400 as the central point. The market is stable and the fluctuations are regular. The core resistance level is the 200-day moving average, corresponding to a price of $4537, which is also a key watershed between the medium- and long-term bullish and bearish trends. The core support level is the $4350 range. This level has repeatedly acted as a support level during pullbacks over the past month, providing stable stabilization and serving as a key bottoming line for short-term gold prices. Bearish Scenario: The market is gradually forming a head and shoulders reversal pattern, a typical bearish signal. If the pattern is fully formed and the gold price effectively breaks below the key $4300 level, the short-term support system will be completely breached. The market will then begin a deep correction, with the medium- to long-term downside target at the core support level of $4000. Bullish Scenario: If gold prices stabilize above the upper limit of the current trading range and successfully break through the 200-day moving average resistance, the technical structure will be fully repaired, and the bullish trend will be officially established. The core upward target is $4770. This price level is both the high point in May of this year and the 50% Fibonacci retracement level of the sharp decline in the first half of the year, making it a highly valuable technical indicator. Risk Warning Historical price movements and market patterns cannot completely predict future market movements and returns. All trading operations involve risk. Strict control of position size and timing is essential during the investment process, along with prudent decision-making.
- Risk Warning and Disclaimer
- The market involves risk, and trading may not be suitable for all investors. This article is for reference only and does not constitute personal investment advice, nor does it take into account certain users’ specific investment objectives, financial situation, or other needs. Any investment decisions made based on this information are at your own risk.