Transportation prices rose, trade prices fell: two types of inflation reflected in the same PPI figure.
2026-09-10 20:58:08
On Thursday, September 10th, the U.S. Bureau of Labor Statistics released the August Producer Price Index (PPI). Final demand PPI rose 0.4% month-over-month, in line with expectations; year-over-year, it rose to 5.4%, slightly higher than the 5.3% forecast, with the July year-over-year figure revised upward from 4.7% to 4.8%. Core PPI, excluding food and energy, rose 0.2% month-over-month, lower than the 0.3% forecast; year-over-year, it rose 4.6%, in line with expectations, with the previous value revised upward from 4.2% to 4.3%. Excluding food, energy, and trade services, core PPI rose 0.3% month-over-month, while the year-over-year figure remained at 4.7%. The revised combination is closer to "slightly overheated aggregate, slightly weaker than expected core," but the single-month slope of the energy component is enough to rewrite the wholesale inflation narrative. After the data release, the dollar index ended its previous three-day decline, with significantly increased short-term volatility; federal funds futures implied a 25 basis point rate hike at the September 15-16 FOMC meeting rose to around 60%. The 10-year US Treasury yield is trading between 4.85% and 4.89%, while Brent crude continues to fluctuate above $100 per barrel. The August Consumer Price Index will be released on Friday, just one trading day after the policy meeting. 
 Subsequent variables, listed in order of priority: Friday's CPI energy and core price gap, whether crude oil will continue to peg diesel prices to high levels, and the wording regarding the "potential inflation rate" in the September 15-16 statement. The PPI has shifted the question from "will it rebound?" to "how much of the rebound will remain?"
The gap between total amount and core: Energy pulls up the slope all at once
The final demand PPI rose 0.4% month-on-month in August, the largest increase in three months, with drivers not being dispersed. Final demand goods rose 1.1% month-on-month, ending two consecutive months of decline; among them, energy rose 4.2% month-on-month, contributing more than three-quarters of the increase in goods prices. Diesel prices jumped 24.1% month-on-month, explaining more than one-third of the increase in goods prices alone, while gasoline, jet fuel, and heating oil also rose. Food prices rose only 0.1%, and residential electricity prices fell 0.5%, indicating that this round of wholesale inflation is not a "basket-wide rise," but rather a concentrated repricing of the fuel chain against the backdrop of the Middle East conflict. The core metric provides another layer of information. Final demand goods excluding food and energy still rose 0.4% month-on-month, showing that goods other than energy have not completely stagnated; however, final demand services rose only 0.1%, and trade services fell 0.2%, pushing the core month-on-month increase down to 0.2%. In other words, the energy shock has entered goods and transportation, but has not yet proportionally penetrated into trade profit margins and the pricing of services in a broader sense. The year-on-year growth rate of 5.4% is 0.6 percentage points higher than the revised 4.8% in July. The base effect and fuel prices have combined to make the figure itself not mild, but the structure determines that it cannot be simply interpreted as "a comprehensive re-acceleration".Intermediate demands incorporate pressure into the next stage.
More informative for the trading floor is intermediate demand. By commodity type, processed goods rose 1.8% month-on-month, unprocessed goods rose 1.1%, and intermediate services rose 0.3%; processed goods rose a significant 11.5% year-on-year, while unprocessed goods rose 12.8% year-on-year. By production process, intermediate demand in the first stage rose 1.4% month-on-month and 11.3% year-on-year, the second and third stages each rose 0.8%, and the fourth stage rose 0.4%. 24.1% of diesel fuel inputs entered multiple stages simultaneously, with the first stage input rising 2.1%, indicating that costs are initially concentrated at the front end of the production chain. The corresponding item on the service side is transportation. Final demand transportation and warehousing rose 2.3% month-on-month, and freight trucking rose 2.0%; intermediate demand transportation and warehousing rose 1.3%. The simultaneous rise in fuel prices and freight rates means that logistics markups have begun to rewrite corporate cost functions. In contrast, trade services declined month-on-month, with some retail and wholesale profit margins giving back, which is the direct source of the core PPI's month-on-month lower-than-expected figure. The fact that intermediate demand remains high year-on-year indicates that August's issue was not an isolated fuel-related disturbance, but rather a re-emergence of existing upstream pressures.How to read this report within a policy framework
Federal Reserve Chairman Warsh made it clear at Jackson Hole on August 28: "We must be confident that underlying inflation is clearly and rapidly approaching our target, or there is still work to be done." He also pointed out that the policy rate has remained in the 3.50% to 3.75% range since December, and the credit market has not strongly felt the tightening. The August PPI cannot alone determine the next interest rate decision, but it changes the weight of the evidence: the total year-on-year growth of 5.4% is far from the 2% target, and the year-on-year growth rate excluding food, energy, and trade is still 4.7%, indicating that the "speed" of underlying inflation has not shown a clear convergence. Market pricing has already priced this weight into the curve. The implied probability of a September rate hike in federal funds futures has risen to around 60%, partly due to inflation readings and partly due to the spillover effect of several consecutive days of rising oil prices on inflation expectations. The 10-year Treasury yield rose above 4.85%, reflecting the synchronization of term premium and policy repricing. What needs to be separated is that the core monthly growth of 0.2% was lower than expected, leaving room for "wait-and-see" regarding the CPI; while the year-on-year comparison of diesel and intermediate demand left room for "not treating energy as a one-off disturbance." Only when both interpretations are valid can this report's policy implications be understood.Observational Framework: The Distance from Wholesale to Consumption
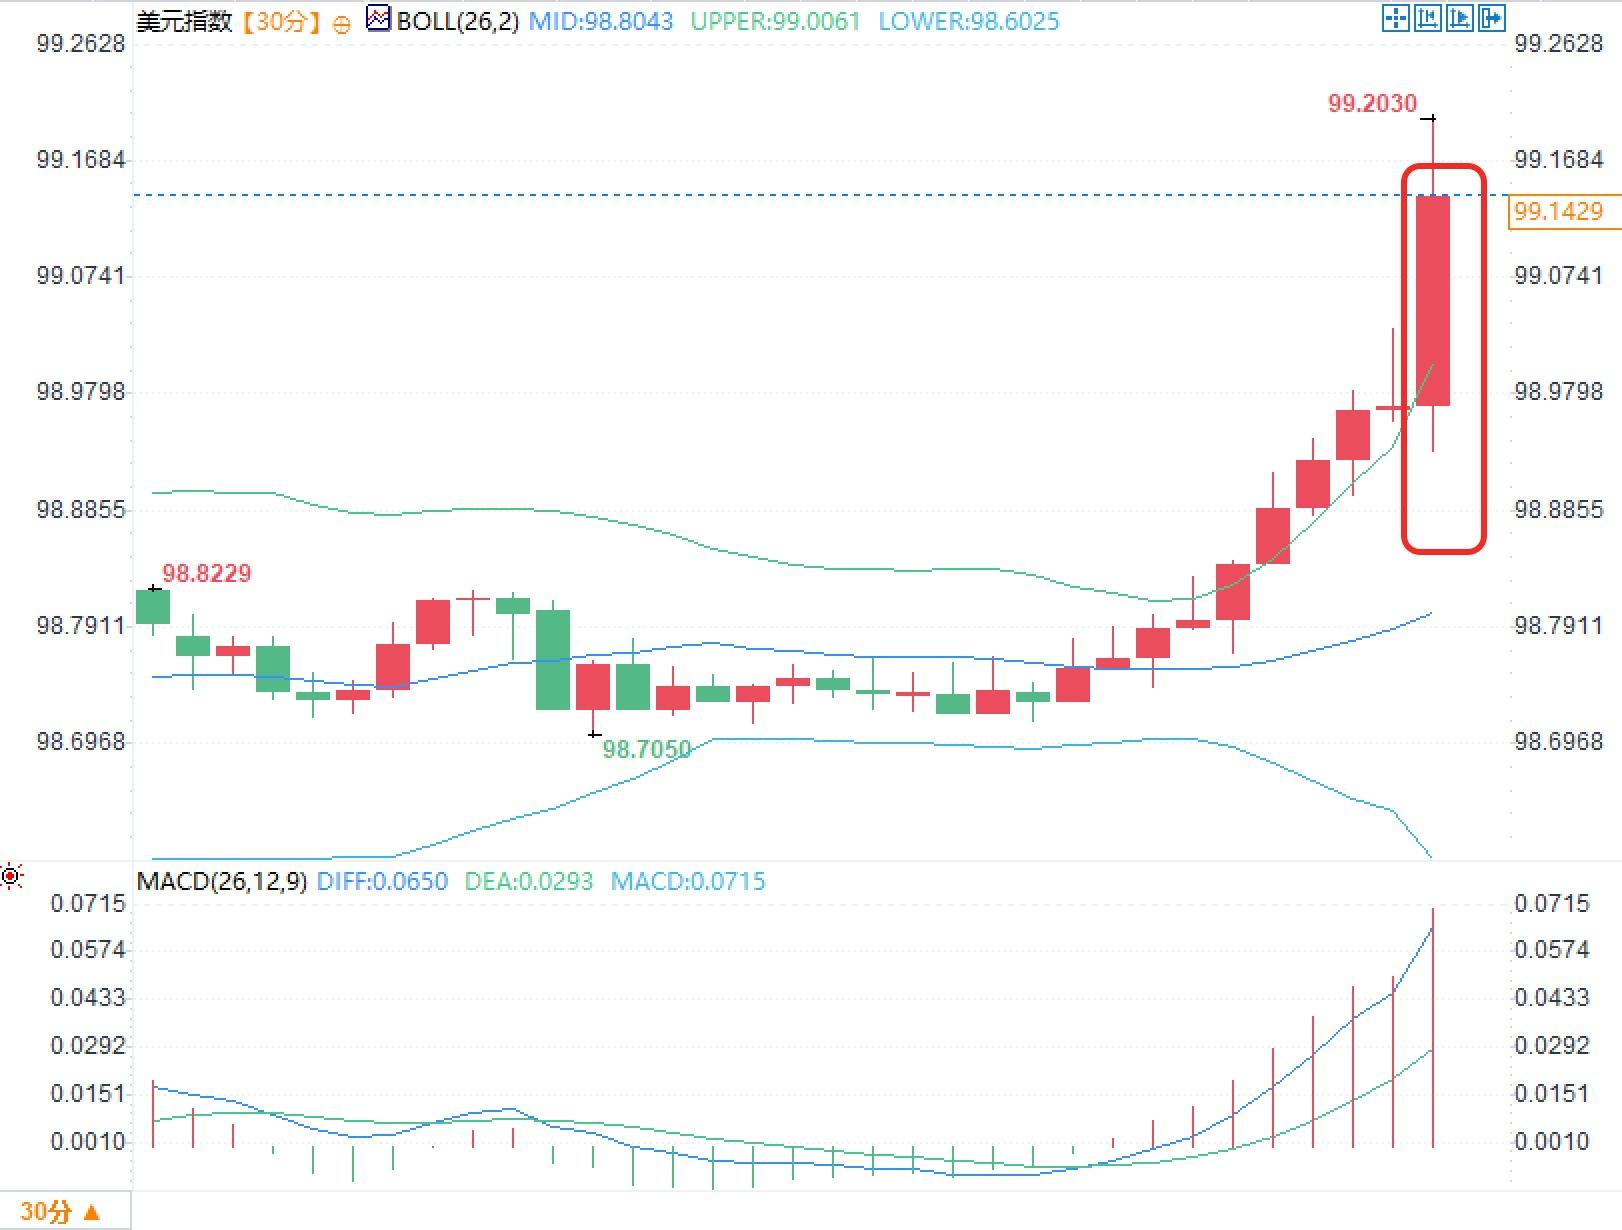
PPI (Producer Price Index) is the price at which businesses sell, while CPI (Consumer Price Index) is the price at which consumers purchase. The two have different time lags and weights. Energy's impact on PPI is faster and steeper, while in CPI it is filtered through refinery markups, retail price increases, and consumer weighting. August's PPI already showed that fuel and freight rates were leading the way; Friday's CPI will examine how much of this cost has entered gasoline, transportation, and core commodities. Historically, a single-month jump in diesel and freight rates may not appear in a significant proportion of the core CPI for that month, but it will increase the variance of the goods and transportation sub-items for the next one to two months. On the 30-minute chart of the US Dollar Index, the Bollinger Bands have widened from a narrowing pattern, with the price briefly moving away from the middle band and approaching the outer edge of the upper band, followed by a long-bodied pullback candlestick. The MACD's DIFF and DEA lines are moving upwards in tandem, and the histogram is expanding, indicating that short-term energy comes from the data impact rather than trend self-confirmation. The area near the Bollinger Middle Band was previously a consolidation zone; after the data release, this zone was broken, and the new fluctuation range needs to be redefined by the next price data release. Subsequent variables, listed in order of priority: Friday's CPI energy and core price gap, whether crude oil will continue to peg diesel prices to high levels, and the wording regarding the "potential inflation rate" in the September 15-16 statement. The PPI has shifted the question from "will it rebound?" to "how much of the rebound will remain?"Frequently Asked Questions
Question 1: Was the US August PPI higher or lower than expected? Answer: The month-on-month increase of 0.4% was in line with expectations, while the year-on-year increase of 5.4% was slightly higher than 5.3%; the core PPI was 0.2% month-on-month, lower than 0.3%. After the July data was revised upwards, the overall volume was slightly overheated, while the core volume was slightly underheated, indicating a structural revision impact, not a one-sided large-scale exceedance of expectations. Question 2: Why is the market still repricing policy despite the weak core PPI? Answer: Diesel rose 24.1% month-on-month, intermediate demand for processed goods rose 11.5% year-on-year, and transportation and warehousing rebounded significantly. Warsh emphasized the speed at which potential inflation is approaching the target. After energy and freight rates enter the production chain, policy discussions cannot rely solely on a single decimal point in the core month-on-month increase. Question 3: What piece of the puzzle is missing after the PPI? Answer: The missing piece is whether the consumer side has absorbed the wholesale price increase. Friday's CPI will provide a comparison of gasoline, transportation, and core commodities. The PPI reflects costs, while the CPI reflects actual costs; the gap between the two reports is what will truly be priced before the interest rate decision.- Risk Warning and Disclaimer
- The market involves risk, and trading may not be suitable for all investors. This article is for reference only and does not constitute personal investment advice, nor does it take into account certain users’ specific investment objectives, financial situation, or other needs. Any investment decisions made based on this information are at your own risk.