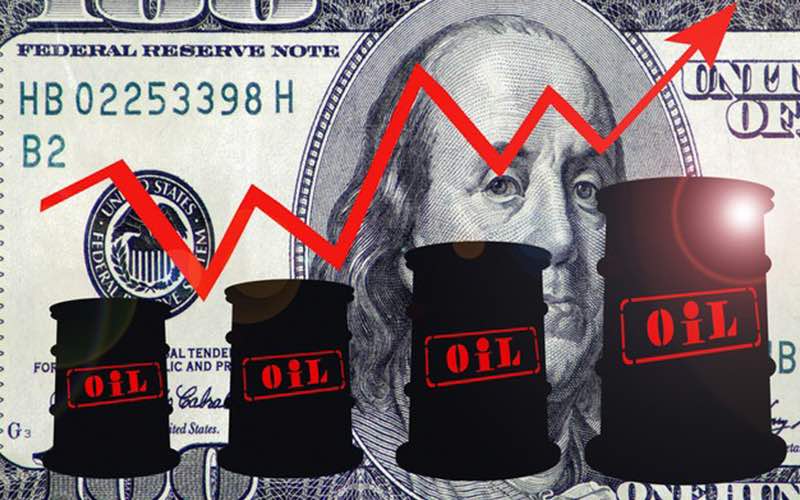
Rising US inflation has fueled expectations of interest rate hikes, sending the dollar index nearing 99.50 after three consecutive days of gains.
2026-09-14 16:02:08
The US dollar index extended its gains in Asian trading on Monday, trading around 99.50, marking its third consecutive day of increases. The dollar has recently regained market attention, primarily driven by US inflation data and rapidly changing expectations regarding Federal Reserve policy. The market has clearly increased its pricing in a September rate hike, thus providing interest rate-side support for the dollar.  Data released by the U.S. Bureau of Labor Statistics showed that the U.S. Consumer Price Index (CPI) rose 0.4% month-over-month and 3.4% year-over-year in August, largely in line with market expectations. However, the core CPI, excluding food and energy, rose 0.3% month-over-month, higher than July's 0.2% and exceeding previous market expectations, indicating that underlying inflationary pressures remain somewhat persistent. The year-over-year growth rate of core CPI fell to 2.4%, but remains above the Federal Reserve's long-term target of 2%. Following the release of the inflation data, the interest rate market quickly adjusted its policy expectations. Currently, the market's pricing in a 25 basis point rate hike at the Fed's September meeting has risen to approximately 86%-87%, significantly higher than the approximately 59% level a week ago. With the Fed meeting scheduled for this week, investors are now more focused not only on whether there will be a rate hike, but also on the policy statement and whether the subsequent interest rate path will continue to lean towards tightening. The relatively high yields on U.S. Treasury bonds have further supported the dollar. Meanwhile, the ongoing situation in the Middle East continues to push up international oil prices, with crude oil prices rising back above $100. Rising energy prices may continue to increase future inflationary pressures, further fueling market expectations that the Fed will maintain a tight policy stance. However, the dollar's rise still faces certain limitations. On the one hand, while US core inflation has rebounded in the short term, its year-on-year growth rate has already declined. On the other hand, if high oil prices begin to significantly suppress global economic growth, the market may refocus on economic growth risks rather than simply betting on further interest rate hikes by the Federal Reserve. Furthermore, the European Central Bank has recently tightened its policy further, and the Bank of Japan also faces expectations of interest rate hikes; policy changes by other major central banks may limit the dollar's further upside potential. From a short-term market perspective, the dollar is currently supported by a positive cycle of "rising inflation – increased interest rate hike expectations – higher US Treasury yields." As long as the policy signals released by the Federal Reserve this week are not significantly lower than market expectations, the dollar index may still test the 100 level. However, if the Federal Reserve raises interest rates but its policy guidance is cautious, the market may experience a "buy the rumor, sell the fact" scenario, and the dollar index may face downward pressure. The dollar index is currently trading around 99.50 on the daily chart, approaching the key moving average resistance area again after a continuous rebound. The short-term 9-day EMA is around 99.12, and the price is currently still trading above this indicator, indicating that the short-term rebound structure has not been broken. However, the 50-day EMA, located around 99.63, is currently the most important technical resistance level. The 14-day RSI is around 48, still in neutral territory, indicating that while the dollar has risen continuously, its momentum has not yet entered a clearly strong phase. The first resistance level to watch is the 50-day EMA around 99.63. If the dollar index can effectively break through and hold above 99.63 with a daily closing price, it means that the previous weak structure has been somewhat repaired, and it may further test the 99.80 and 100.00 psychological levels. If it breaks through 100.00, the market may reassess the dollar's medium-term trend. On the downside, the first resistance level to watch is the 9-day EMA around 99.12. If the dollar index falls below 99.12 again, it means that the recent rebound momentum is weakening, and it may fall back to around 98.80 in the short term; if 98.80 is further breached, it may retest the 98.50 or even 98.30 area. Overall, until the US dollar index effectively breaks through 99.63, the daily chart still tends to define it as a rebound within a weak market. The 4-hour chart shows that the US dollar index has recently formed a relatively clear short-term rebound structure, but as the price approaches the 99.50-99.65 area, upward pressure is increasing. 99.50 is currently an important short-term psychological level, while 99.63 forms a confluence of resistance with the daily 50-day EMA. If the price encounters resistance and falls back in this area, 99.20-99.12 forms the first support zone; a break below this level may lead to a renewed search for support near 98.80. If the 4-hour chart can break through 99.63 and hold above it, the short-term structure will further strengthen, potentially opening up space towards 99.80 and 100.00. Conversely, if the price fails to break through the 99.50-99.63 area and falls below 99.12, this rebound may enter a technical correction phase.
 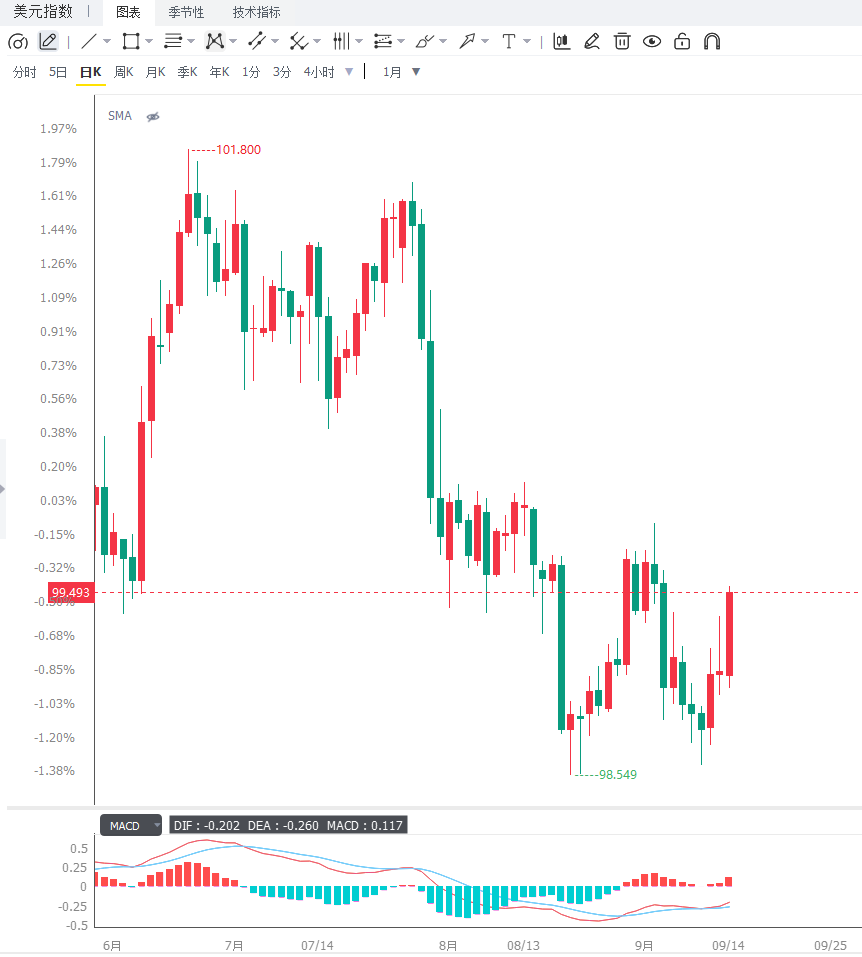 Editor's Summary: US core inflation unexpectedly rose in August, significantly increasing market expectations for a Fed rate hike in September, causing the dollar index to strengthen for the third consecutive trading day. Currently, the dollar's core support comes from interest rate expectations and US Treasury yields, while high oil prices may further intensify inflation concerns. However, the 50-day EMA around 99.63 remains key to determining whether the dollar can truly reverse its short-term weakness. In the short term, watch for a break above 99.63, while key support levels to watch are 99.12 and 98.80.
Data released by the U.S. Bureau of Labor Statistics showed that the U.S. Consumer Price Index (CPI) rose 0.4% month-over-month and 3.4% year-over-year in August, largely in line with market expectations. However, the core CPI, excluding food and energy, rose 0.3% month-over-month, higher than July's 0.2% and exceeding previous market expectations, indicating that underlying inflationary pressures remain somewhat persistent. The year-over-year growth rate of core CPI fell to 2.4%, but remains above the Federal Reserve's long-term target of 2%. Following the release of the inflation data, the interest rate market quickly adjusted its policy expectations. Currently, the market's pricing in a 25 basis point rate hike at the Fed's September meeting has risen to approximately 86%-87%, significantly higher than the approximately 59% level a week ago. With the Fed meeting scheduled for this week, investors are now more focused not only on whether there will be a rate hike, but also on the policy statement and whether the subsequent interest rate path will continue to lean towards tightening. The relatively high yields on U.S. Treasury bonds have further supported the dollar. Meanwhile, the ongoing situation in the Middle East continues to push up international oil prices, with crude oil prices rising back above $100. Rising energy prices may continue to increase future inflationary pressures, further fueling market expectations that the Fed will maintain a tight policy stance. However, the dollar's rise still faces certain limitations. On the one hand, while US core inflation has rebounded in the short term, its year-on-year growth rate has already declined. On the other hand, if high oil prices begin to significantly suppress global economic growth, the market may refocus on economic growth risks rather than simply betting on further interest rate hikes by the Federal Reserve. Furthermore, the European Central Bank has recently tightened its policy further, and the Bank of Japan also faces expectations of interest rate hikes; policy changes by other major central banks may limit the dollar's further upside potential. From a short-term market perspective, the dollar is currently supported by a positive cycle of "rising inflation – increased interest rate hike expectations – higher US Treasury yields." As long as the policy signals released by the Federal Reserve this week are not significantly lower than market expectations, the dollar index may still test the 100 level. However, if the Federal Reserve raises interest rates but its policy guidance is cautious, the market may experience a "buy the rumor, sell the fact" scenario, and the dollar index may face downward pressure. The dollar index is currently trading around 99.50 on the daily chart, approaching the key moving average resistance area again after a continuous rebound. The short-term 9-day EMA is around 99.12, and the price is currently still trading above this indicator, indicating that the short-term rebound structure has not been broken. However, the 50-day EMA, located around 99.63, is currently the most important technical resistance level. The 14-day RSI is around 48, still in neutral territory, indicating that while the dollar has risen continuously, its momentum has not yet entered a clearly strong phase. The first resistance level to watch is the 50-day EMA around 99.63. If the dollar index can effectively break through and hold above 99.63 with a daily closing price, it means that the previous weak structure has been somewhat repaired, and it may further test the 99.80 and 100.00 psychological levels. If it breaks through 100.00, the market may reassess the dollar's medium-term trend. On the downside, the first resistance level to watch is the 9-day EMA around 99.12. If the dollar index falls below 99.12 again, it means that the recent rebound momentum is weakening, and it may fall back to around 98.80 in the short term; if 98.80 is further breached, it may retest the 98.50 or even 98.30 area. Overall, until the US dollar index effectively breaks through 99.63, the daily chart still tends to define it as a rebound within a weak market. The 4-hour chart shows that the US dollar index has recently formed a relatively clear short-term rebound structure, but as the price approaches the 99.50-99.65 area, upward pressure is increasing. 99.50 is currently an important short-term psychological level, while 99.63 forms a confluence of resistance with the daily 50-day EMA. If the price encounters resistance and falls back in this area, 99.20-99.12 forms the first support zone; a break below this level may lead to a renewed search for support near 98.80. If the 4-hour chart can break through 99.63 and hold above it, the short-term structure will further strengthen, potentially opening up space towards 99.80 and 100.00. Conversely, if the price fails to break through the 99.50-99.63 area and falls below 99.12, this rebound may enter a technical correction phase. Editor's Summary: US core inflation unexpectedly rose in August, significantly increasing market expectations for a Fed rate hike in September, causing the dollar index to strengthen for the third consecutive trading day. Currently, the dollar's core support comes from interest rate expectations and US Treasury yields, while high oil prices may further intensify inflation concerns. However, the 50-day EMA around 99.63 remains key to determining whether the dollar can truly reverse its short-term weakness. In the short term, watch for a break above 99.63, while key support levels to watch are 99.12 and 98.80.
- Risk Warning and Disclaimer
- The market involves risk, and trading may not be suitable for all investors. This article is for reference only and does not constitute personal investment advice, nor does it take into account certain users’ specific investment objectives, financial situation, or other needs. Any investment decisions made based on this information are at your own risk.