













The IEA cuts demand by another 2.5 million barrels, and high oil prices are beginning to reverse the balance sheet.
2026-09-17 19:22:13
On Thursday, September 17th, Brent crude oil was trading below $104 per barrel. The price pullback from its mid-September high of around $109.70 per barrel directly corresponds to two news items: Saudi Aramco is working to bypass the damaged pipeline section and aims to restore about half of the east-west pipeline's capacity within days; and US President Trump recently stated that he has received "direct" contact from Iran. The UN General Assembly general debate will open in New York on September 22nd, and the leaders or foreign ministers of the six Gulf Cooperation Council countries are expected to meet with their US counterparts on the sidelines of the session on the same day. Supply recovery timelines and diplomatic rhetoric are simultaneously becoming central to pricing, and risk premiums are beginning to be recalibrated. 
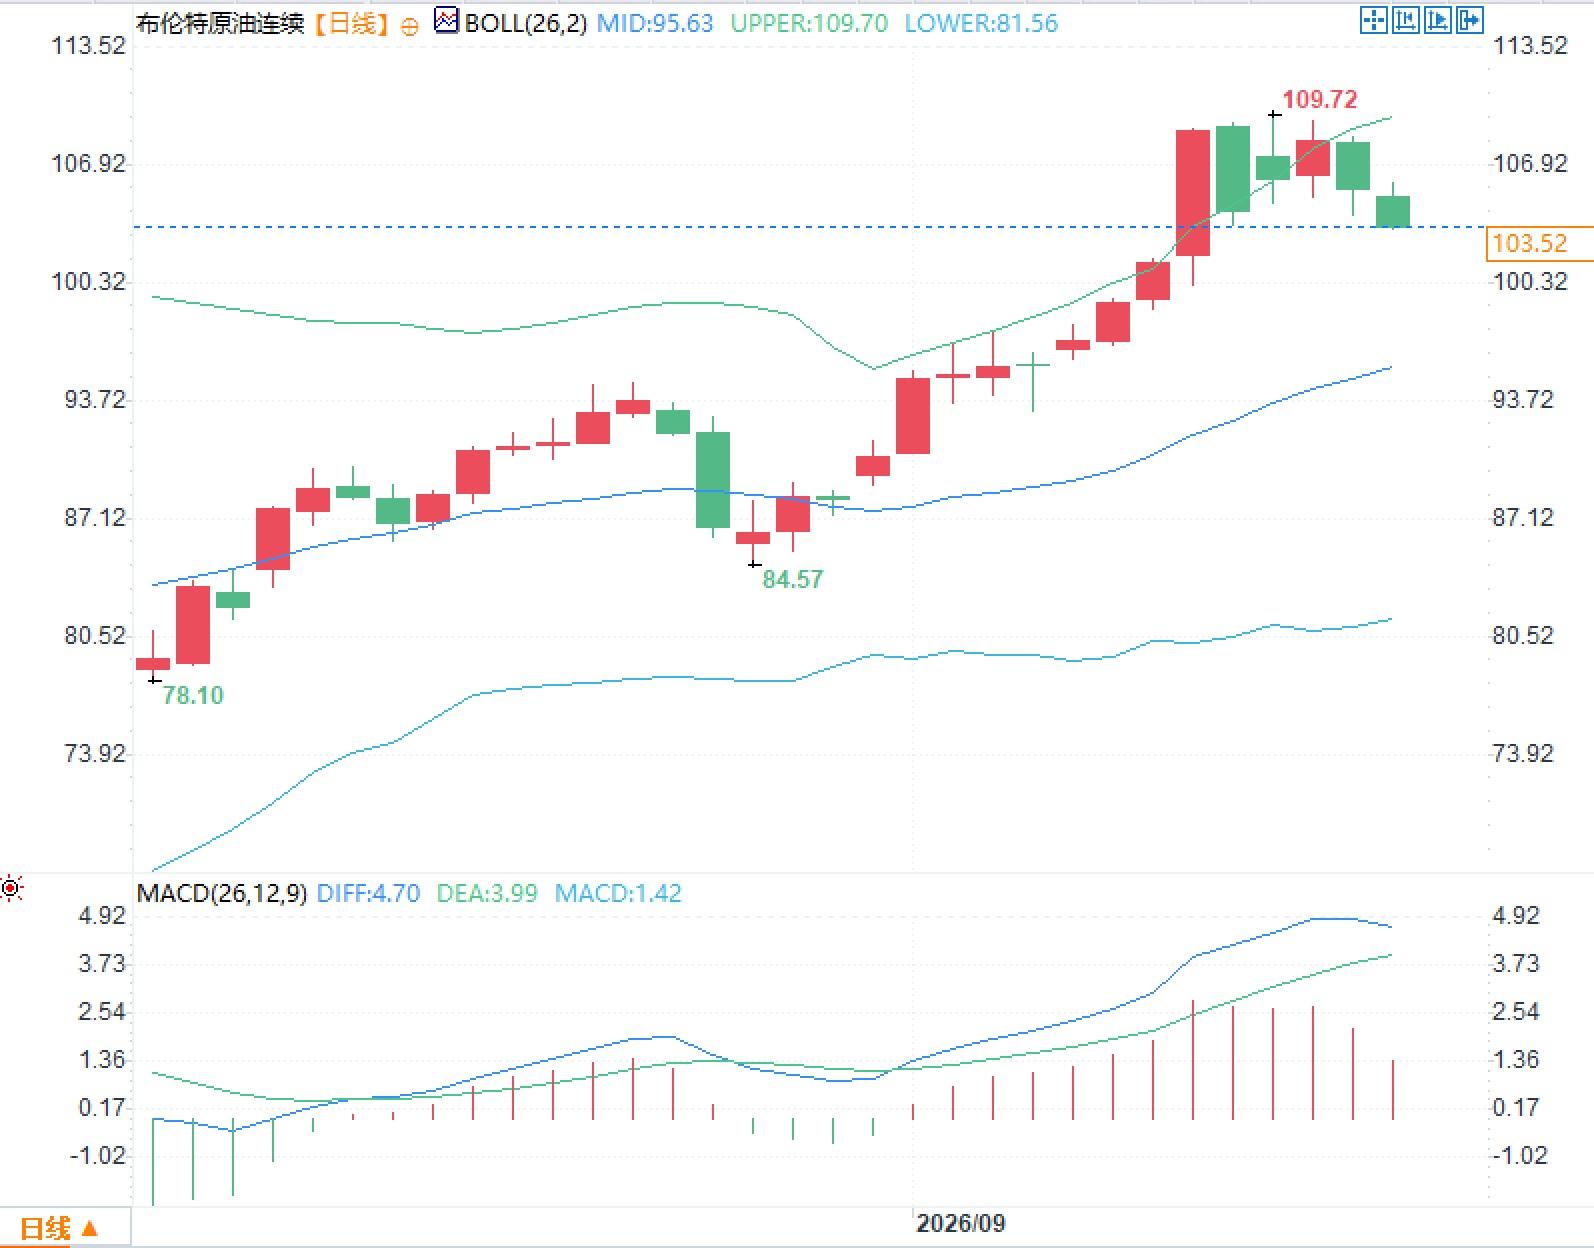 The MACD indicator shows a DIFF of approximately 4.70, a DEA of approximately 3.99, and a histogram value of approximately 1.42. The histogram remains above the zero line, but the height of the recent bars has shortened compared to the peak. This indicates that the fast and slow lines are still on the same side, but the momentum reading has converged from the peak.
East-west pipeline repairs alter short-term supply narrative
The east-west pipeline connects Saudi Arabia's eastern oil-producing region with the port of Yanbu on the Red Sea coast, functioning to maintain westward exports when the Strait of Hormuz is blocked. Following last week's drone attack, the pipeline shut down, damaging two pumping stations, and the market briefly re-included millions of barrels of westward export capacity in its cost estimates. Public information indicates that Saudi Aramco is bypassing the damaged section of the pipeline, aiming to restore about half of its capacity within days, with full restoration taking approximately six weeks. US Energy Secretary Wright stated in an interview that damage assessments are still underway and the pipeline will be operational "soon." It's crucial to distinguish between "partial resumption of production" and "normalization of the pipeline." Half-capacity only alleviates the westward bottleneck and does not equate to a return of overall Gulf exports to pre-conflict levels. The International Energy Agency's September monthly report lowered its 2026 global oil supply forecast to an average of 100.7 million barrels per day, a decrease of approximately 5.7 million barrels per day from the previous year, and postponed a full recovery in Gulf production until 2027. The agency estimates that Gulf oil exports in August were approximately 13 million barrels per day, close to half of pre-conflict levels. Inventories fell by another 95 million barrels in August, bringing the cumulative decrease since February to approximately 507 million barrels, equivalent to about 2.8 million barrels per day. Pipeline repairs are a variable that mitigates the incremental shortfall, not a one-time rewrite of the balance sheet. Bypassing the Strait of Hormuz also involves insurance rates, escort arrangements, and risks on the Red Sea side. If Yanbu loading resumes, whether shipping schedules and capacity can keep up is more crucial than verbal timelines in determining whether spot goods can arrive. Therefore, the market is dividing the "several days" and "six weeks" into two observation windows: the former to test whether some of the repatriation has materialized, and the latter to test whether the entire supply chain is on schedule.Diplomatic Rhetoric and the Risk Premium of the UN General Assembly Meeting
The US-Iran conflict has entered its seventh month since escalating on February 28th, with alternating periods of air traffic control, escort missions, and strikes continuing in the Strait of Hormuz. The air corridor has not been stably restored since the June memorandum. The UN General Assembly general debate opens on September 22nd. Sources indicate that the US State Department has extended preliminary invitations for Trump to discuss post-conflict arrangements and a "post-conflict" framework with the leaders or foreign ministers of Saudi Arabia, the UAE, Qatar, Bahrain, Kuwait, and Oman; a more comprehensive plan may be finalized after the November midterm elections. Last year, the US presented a draft Gaza plan to several countries during the UN General Assembly, which was subsequently made public and facilitated an agreement. This precedent is being used to gauge the information weight of this meeting, but the outcome cannot be directly extrapolated. The risk premium is sensitive to conciliatory wording because the current price includes a premium for corridor disruption. A softening of wording and a confirmed meeting schedule will initially compress the premium; however, if the meeting remains merely an intention, or if further attacks and shipping disruptions occur, the premium will rise again. The pricing targets verifiable implementation details: whether the ceasefire is in writing, the rules for navigation in the strait, the scope of escort, sanctions, and export licenses.Inventory and demand constraints: High prices are rewriting the balance sheet.
The latest weekly data from the U.S. Energy Information Administration shows that for the week ending September 11, commercial crude oil inventories fell by 640,000 barrels to 423.4 million barrels, marking the third consecutive week of decline, though the drop was smaller than the market median expectation. Cushing inventories fell by 342,000 barrels to 21.5 million barrels, and strategic petroleum reserves fell by 403,000 barrels to 285 million barrels. Gasoline inventories increased by 794,000 barrels to 207.7 million barrels, while distillate fuel inventories increased by 1.6 million barrels. U.S. crude oil production was approximately 13.9 million barrels per day, while exports rose to 4.83 million barrels per day during the week. The simultaneous slight decrease in inventories and the rebound in refined product prices indicate that the domestic balance has not tightened unilaterally, and export strength remains an important explanation for inventory changes. The International Energy Agency lowered its 2026 global oil demand forecast by approximately 2.5 million barrels per day, citing factors including congested transportation routes, high fuel prices, and losses in the supply of petrochemical feedstocks and refined products. High oil prices have a reverse effect on the balance sheet through transportation fuels, industrial energy consumption, and contraction in end-user demand. This is what distinguishes this round of market movements from a simple supply shock. The Brent crude oil near-month and far-month spread remains steep: when the November contract was trading around $103/barrel, the December contract was around $100/barrel, and the January 2027 contract around $96/barrel. The curve incorporates both near-term channel risks and long-term recovery expectations into its structure, without pre-specifying the near-month direction. Cross-asset constraints also exist. Rising energy prices have pushed up inflation expectations and long-term yields, leading to increased discussions on monetary policy. For crude oil pricing, this constitutes an implicit brake on the demand side, rather than a one-way story of financial buying. Refinery operating rates in Europe and the US, as well as diesel cracking, are still supported by the Middle East refined product export gap. However, whether this gap can be sustained depends on the two physical channels—pipelines and straits—rather than market sentiment.Current state of daily indicators
On the daily chart for Brent crude oil, the Bollinger Bands have the middle band at approximately 95.63, the upper band at approximately 109.70, and the lower band at approximately 81.56. The recent high is marked around 109.72, close to the upper band; the latest trading session is between the middle and upper bands. The MACD indicator shows a DIFF of approximately 4.70, a DEA of approximately 3.99, and a histogram value of approximately 1.42. The histogram remains above the zero line, but the height of the recent bars has shortened compared to the peak. This indicates that the fast and slow lines are still on the same side, but the momentum reading has converged from the peak.
- Risk Warning and Disclaimer
- The market involves risk, and trading may not be suitable for all investors. This article is for reference only and does not constitute personal investment advice, nor does it take into account certain users’ specific investment objectives, financial situation, or other needs. Any investment decisions made based on this information are at your own risk.

