Falling oil prices eased inflationary pressures, causing gold to rebound above $4,300 and return to the upper limit of its trading range.
2026-09-18 09:30:10
Spot gold rebounded in early Asian trading on Friday, with XAU/USD approaching $4360 again, indicating a technical correction after a period of rapid adjustment. The rebound was driven by two main factors: firstly, a significant drop in oil prices, leading to lower energy costs and easing concerns about further inflation; and secondly, a weakening US dollar, reducing exchange rate pressure on dollar-denominated gold. However, given the still hawkish stance of the Federal Reserve's latest policy signals, the current rise in gold is more of a low-level correction than a confirmation of a new one-sided trend.  Changes in the energy market are reshaping the pricing logic of precious metals. Crude oil prices recently fell to a one-week low, fueling market expectations that supply disruptions in the Middle East may gradually ease. Saudi Arabia's pursuit of partially restoring oil transport on a key pipeline has further reduced concerns about continued supply tightening. The decline in oil prices signifies a temporary cooling of energy-driven inflationary pressures, while also reducing market concerns about further monetary policy tightening. This has a dual impact on gold: the drop in oil prices weakens the direct support for gold from inflation, but if the decline in energy prices further leads to a drop in yields and the dollar, it can provide support for gold prices through financial market channels. The correlation between energy prices and gold has recently strengthened. David Meg, head of metals trading at High Ridge Futures, stated that the significant decline in energy prices is easing the burden on the gold market previously created by inflationary pressures. For the current market, investors are no longer just focused on safe-haven demand, but rather on whether changes in oil prices can further influence US interest rates and the dollar's trajectory through inflation expectations. At the same time, a weaker dollar has also improved the short-term environment for gold. Gold is priced in US dollars, and a stronger dollar typically increases the cost of gold for investors using other currencies, while a weaker dollar helps improve gold's relative attractiveness. During the previous period of sustained gold price declines, a stronger dollar and rising US Treasury yields created dual pressures, so gold is prone to a rebound whenever the dollar's upward momentum weakens. However, the biggest limiting factor for the gold market currently remains US monetary policy. The Federal Reserve raised its benchmark interest rate by 25 basis points to a range of 3.75% to 4.00% on Wednesday, while policy forecasts still indicate at least one more rate hike this year. Rather than focusing solely on the rate hike itself, the market is more concerned about whether the Fed will maintain higher interest rates and how long this high-interest-rate environment will last. The CME Group Federal Funds Rate Watch tool shows that the market currently expects a 53.1% probability of another Fed rate hike in October, up from about 44% in the previous trading day. The probability of a rate hike in October rising back above 50% indicates that expectations of a Fed rate cut have been further suppressed. If subsequent US inflation or employment data continue to show strong resilience, the market may further price in another rate hike, potentially causing the dollar and US Treasury yields to rise again, putting renewed pressure on gold. Recent performance of US Treasury yields already demonstrates that interest rates remain a significant suppressive factor for gold. Market strategists point out that after the Fed's decision, a stronger dollar and rising US Treasury yields led to a significant pullback in gold, with the 2-year Treasury yield briefly approaching 4.75% and the 10-year yield returning to near 5%. Higher yields increase the opportunity cost of holding gold, as gold itself does not generate interest income. When risk-free or low-risk yields remain high, the relative attractiveness of allocating funds to gold is affected. However, the current gold correction does not mean the medium-term upward trend has completely disappeared. Market strategists believe that the Fed's hawkish interest rate path is already largely reflected in current asset prices. If future US economic data begins to cool and the market lowers its interest rate expectations again, then US Treasury yields and the dollar may fall in tandem, giving gold a chance to regain upward momentum. Therefore, whether gold prices can resume their upward trend largely depends on whether US macroeconomic data can change current interest rate pricing. From a sentiment perspective, gold's rebound after falling to a six-week low indicates that some funds are starting to look for low-level allocation opportunities, but the market has not fully turned optimistic. The current price around $4345 is still in a recovery phase after the previous decline, and investors remain highly sensitive to changes in the Fed's policy path, the dollar, and yields. If gold prices fail to break through key technical resistance, short-term funds may still choose to reduce positions on rallies. The future trend of oil prices also deserves close attention. If Middle Eastern oil supply gradually recovers and energy prices continue to decline, market inflation expectations may further cool, which will help reduce the pressure on interest rates to continue rising. Conversely, if supply recovery is slower than expected and oil prices rise again, energy costs may push up inflation expectations again and increase the time the Fed maintains its restrictive interest rate level, thus putting new pressure on gold. Currently, three transmission chains need to be closely monitored: first, whether oil prices continue to fall; second, whether US inflation and employment data can change expectations of an October rate hike; and third, whether the dollar and US Treasury yields can weaken in tandem. Only when the dollar and yields show a clearer downward correlation will the gold rebound be more likely to transform from a technical correction into a trend reversal. From a daily chart perspective, spot gold had previously fallen to a six-week low before rebounding to around $4345. The price remains above the 100-day moving average, indicating that the medium-term bullish structure has not been completely destroyed, but the short-term trend has shifted from a strong upward move to a consolidation phase after a period of adjustment. The current 100-day moving average is around $4325, a key support area on the daily chart; as long as the price can hold above this level, there is still room for further correction. The first resistance level to watch is the Bollinger Band middle line around $4435, which is also the first major resistance level to be broken in this rebound. If the price can effectively hold above $4435, the short-term bullish momentum is expected to strengthen further, potentially testing the upper Bollinger Band around $4678. However, $4678 is still a significant level away from the current price, and without a significant weakening of the US dollar and US Treasury yields, a direct breakthrough of this area will be difficult. The daily RSI is currently around 48.58, still in the neutral zone, not yet in overbought or oversold territory, indicating that the balance of power between bulls and bears has not yet shifted significantly. The neutral RSI performance is largely consistent with the current price structure, suggesting the market is undergoing a directional readjustment rather than a clear trend reversal. If $4325 is breached, gold prices may retest the lower Bollinger Band near $4190; whether this area holds will directly determine the sustainability of the medium-term uptrend. Looking at the 4-hour chart, gold prices have begun a low-level rebound after a rapid decline, with short-term bearish momentum weakening, but the rebound trend still needs further confirmation through a breakout above previous resistance. The current price action is around $4345, while $4325 forms a crucial short-term support level. If gold prices continue to hold above $4325 and break through $4435, the 4-hour rebound structure is likely to strengthen further; if the attempt to break $4435 fails and prices fall back below $4325, it indicates the market remains in a weak consolidation phase, and prices may again seek support near $4190. Overall, the current technical structure is more inclined towards low-level consolidation and repair. A true trend reversal still requires a break above $4,435 and the support of a weakening dollar and yields.
 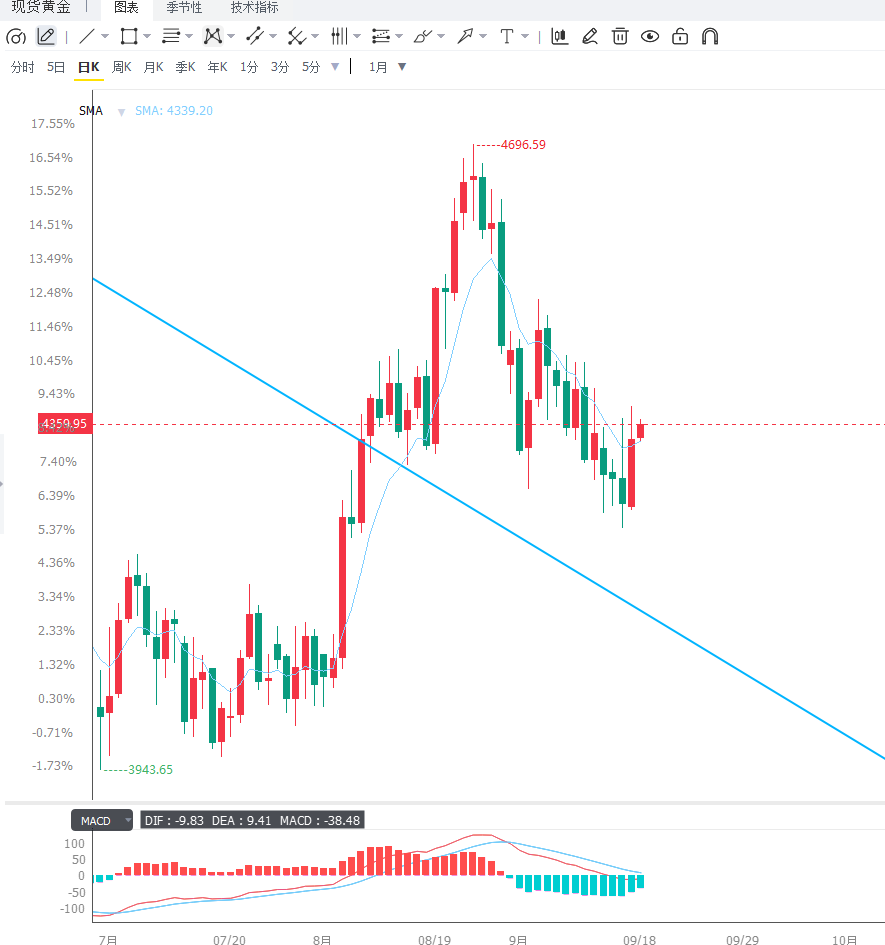 Editor's Summary: Gold is currently caught in a tug-of-war between hawkish policy and falling energy prices. Lower oil prices and a weaker dollar have provided short-term support for gold, but the Federal Reserve's continued high interest rates, with the probability of another rate hike in October rising to 53.1%, mean that gold remains constrained by high opportunity costs. Technically, $4325 is a key support level, while $4435 is a crucial resistance level for further upward movement. If the dollar and US Treasury yields continue to decline, gold is likely to continue its low-level recovery; however, if strong US data further fuels expectations of rate hikes, gold prices may face renewed pressure. In the short term, market focus has shifted from solely safe-haven demand to the interconnected changes in oil prices, inflation, interest rates, and the dollar.
Changes in the energy market are reshaping the pricing logic of precious metals. Crude oil prices recently fell to a one-week low, fueling market expectations that supply disruptions in the Middle East may gradually ease. Saudi Arabia's pursuit of partially restoring oil transport on a key pipeline has further reduced concerns about continued supply tightening. The decline in oil prices signifies a temporary cooling of energy-driven inflationary pressures, while also reducing market concerns about further monetary policy tightening. This has a dual impact on gold: the drop in oil prices weakens the direct support for gold from inflation, but if the decline in energy prices further leads to a drop in yields and the dollar, it can provide support for gold prices through financial market channels. The correlation between energy prices and gold has recently strengthened. David Meg, head of metals trading at High Ridge Futures, stated that the significant decline in energy prices is easing the burden on the gold market previously created by inflationary pressures. For the current market, investors are no longer just focused on safe-haven demand, but rather on whether changes in oil prices can further influence US interest rates and the dollar's trajectory through inflation expectations. At the same time, a weaker dollar has also improved the short-term environment for gold. Gold is priced in US dollars, and a stronger dollar typically increases the cost of gold for investors using other currencies, while a weaker dollar helps improve gold's relative attractiveness. During the previous period of sustained gold price declines, a stronger dollar and rising US Treasury yields created dual pressures, so gold is prone to a rebound whenever the dollar's upward momentum weakens. However, the biggest limiting factor for the gold market currently remains US monetary policy. The Federal Reserve raised its benchmark interest rate by 25 basis points to a range of 3.75% to 4.00% on Wednesday, while policy forecasts still indicate at least one more rate hike this year. Rather than focusing solely on the rate hike itself, the market is more concerned about whether the Fed will maintain higher interest rates and how long this high-interest-rate environment will last. The CME Group Federal Funds Rate Watch tool shows that the market currently expects a 53.1% probability of another Fed rate hike in October, up from about 44% in the previous trading day. The probability of a rate hike in October rising back above 50% indicates that expectations of a Fed rate cut have been further suppressed. If subsequent US inflation or employment data continue to show strong resilience, the market may further price in another rate hike, potentially causing the dollar and US Treasury yields to rise again, putting renewed pressure on gold. Recent performance of US Treasury yields already demonstrates that interest rates remain a significant suppressive factor for gold. Market strategists point out that after the Fed's decision, a stronger dollar and rising US Treasury yields led to a significant pullback in gold, with the 2-year Treasury yield briefly approaching 4.75% and the 10-year yield returning to near 5%. Higher yields increase the opportunity cost of holding gold, as gold itself does not generate interest income. When risk-free or low-risk yields remain high, the relative attractiveness of allocating funds to gold is affected. However, the current gold correction does not mean the medium-term upward trend has completely disappeared. Market strategists believe that the Fed's hawkish interest rate path is already largely reflected in current asset prices. If future US economic data begins to cool and the market lowers its interest rate expectations again, then US Treasury yields and the dollar may fall in tandem, giving gold a chance to regain upward momentum. Therefore, whether gold prices can resume their upward trend largely depends on whether US macroeconomic data can change current interest rate pricing. From a sentiment perspective, gold's rebound after falling to a six-week low indicates that some funds are starting to look for low-level allocation opportunities, but the market has not fully turned optimistic. The current price around $4345 is still in a recovery phase after the previous decline, and investors remain highly sensitive to changes in the Fed's policy path, the dollar, and yields. If gold prices fail to break through key technical resistance, short-term funds may still choose to reduce positions on rallies. The future trend of oil prices also deserves close attention. If Middle Eastern oil supply gradually recovers and energy prices continue to decline, market inflation expectations may further cool, which will help reduce the pressure on interest rates to continue rising. Conversely, if supply recovery is slower than expected and oil prices rise again, energy costs may push up inflation expectations again and increase the time the Fed maintains its restrictive interest rate level, thus putting new pressure on gold. Currently, three transmission chains need to be closely monitored: first, whether oil prices continue to fall; second, whether US inflation and employment data can change expectations of an October rate hike; and third, whether the dollar and US Treasury yields can weaken in tandem. Only when the dollar and yields show a clearer downward correlation will the gold rebound be more likely to transform from a technical correction into a trend reversal. From a daily chart perspective, spot gold had previously fallen to a six-week low before rebounding to around $4345. The price remains above the 100-day moving average, indicating that the medium-term bullish structure has not been completely destroyed, but the short-term trend has shifted from a strong upward move to a consolidation phase after a period of adjustment. The current 100-day moving average is around $4325, a key support area on the daily chart; as long as the price can hold above this level, there is still room for further correction. The first resistance level to watch is the Bollinger Band middle line around $4435, which is also the first major resistance level to be broken in this rebound. If the price can effectively hold above $4435, the short-term bullish momentum is expected to strengthen further, potentially testing the upper Bollinger Band around $4678. However, $4678 is still a significant level away from the current price, and without a significant weakening of the US dollar and US Treasury yields, a direct breakthrough of this area will be difficult. The daily RSI is currently around 48.58, still in the neutral zone, not yet in overbought or oversold territory, indicating that the balance of power between bulls and bears has not yet shifted significantly. The neutral RSI performance is largely consistent with the current price structure, suggesting the market is undergoing a directional readjustment rather than a clear trend reversal. If $4325 is breached, gold prices may retest the lower Bollinger Band near $4190; whether this area holds will directly determine the sustainability of the medium-term uptrend. Looking at the 4-hour chart, gold prices have begun a low-level rebound after a rapid decline, with short-term bearish momentum weakening, but the rebound trend still needs further confirmation through a breakout above previous resistance. The current price action is around $4345, while $4325 forms a crucial short-term support level. If gold prices continue to hold above $4325 and break through $4435, the 4-hour rebound structure is likely to strengthen further; if the attempt to break $4435 fails and prices fall back below $4325, it indicates the market remains in a weak consolidation phase, and prices may again seek support near $4190. Overall, the current technical structure is more inclined towards low-level consolidation and repair. A true trend reversal still requires a break above $4,435 and the support of a weakening dollar and yields. Editor's Summary: Gold is currently caught in a tug-of-war between hawkish policy and falling energy prices. Lower oil prices and a weaker dollar have provided short-term support for gold, but the Federal Reserve's continued high interest rates, with the probability of another rate hike in October rising to 53.1%, mean that gold remains constrained by high opportunity costs. Technically, $4325 is a key support level, while $4435 is a crucial resistance level for further upward movement. If the dollar and US Treasury yields continue to decline, gold is likely to continue its low-level recovery; however, if strong US data further fuels expectations of rate hikes, gold prices may face renewed pressure. In the short term, market focus has shifted from solely safe-haven demand to the interconnected changes in oil prices, inflation, interest rates, and the dollar.
- Risk Warning and Disclaimer
- The market involves risk, and trading may not be suitable for all investors. This article is for reference only and does not constitute personal investment advice, nor does it take into account certain users’ specific investment objectives, financial situation, or other needs. Any investment decisions made based on this information are at your own risk.