The gold-silver ratio has returned to around 65; what has silver corrected in this round?
2026-09-18 19:16:10
On Friday, September 18th, spot silver underwent a sharp price correction in the consecutive trading days following the Federal Reserve's decision. The Fed recently raised the target range for the federal funds rate by 25 basis points to 3.75% to 4.00%, marking the first rate hike since 2023. Spot silver had previously fallen below $63/ounce, but subsequently rebounded rapidly as the market reinterpreted the Fed's dot plot, crude oil prices retreated from their highs, and the 10-year Treasury yield fell from around 5%. Spot silver is currently trading around $67/ounce, a rebound of over 6% from its recent low, with the gold-silver ratio falling to around 65.3 to 65.4. The core of this volatility is not the 25 basis points themselves, but rather the compression of market expectations regarding the interest rate path after the end of 2026, coupled with a temporary easing of energy premiums related to the Middle East conflict. 
 The market is likely to focus on three sets of information going forward: First, whether subsequent US inflation and employment trends will strengthen or weaken the median of the dot plot's "another increase in 2026, no change in 2027"; second, whether crude oil can continue to retreat from above $100/barrel, thereby changing the slope of the energy component in the PCE; and third, whether physical lease rates, exchange inventories, and industrial orders show that the gap is accelerating or being suppressed by high prices. Once positions are crowded, even if the data shows only a mild deviation, silver's elasticity will be greater than most industrial metals.
How Interest Rate Path Repricing Rewrites the Holding Cost of Silver
Silver, as a non-coupon asset, is highly sensitive to real interest rates and the long-term policy path. The rate hike at this meeting was largely in line with market pre-pricing; the real trigger for repricing was the summary of economic projections. Of the 18 officials who submitted projections, 12 pointed to a median interest rate of 4.1% by the end of 2026, corresponding to another hike this year; 4 pointed to a higher path, and only 2 believed that maintaining the current range was sufficient. The median for the end of 2027 also fell to 4.1%, meaning the committee has not yet included a rate cut in 2027; room for a downward shift will only be given again in 2028, with the long-term neutral interest rate revised upward from 3.1% in June to 3.2%. The market pre-emptively priced in additional tightening in 2027. The dot plot was consistent with the market in 2026, but fewer rate hikes in 2027 than the market had priced in. Fed Chairman Warsh emphasized at the press conference that inflation remains too high and has lasted too long, and that the summer data is insufficient to prove a substantial improvement in the underlying trend, estimating the overall PCE year-on-year growth in August to be approximately 3.6%. He also stated that it's difficult to describe broad financial conditions as restrictive, therefore he described this rate hike as a partial withdrawal of easing. Warsh continued his usual practice of not submitting a dot plot and downplaying forward guidance. For silver, this creates a hedge: further rate hikes are still possible in the near term, but the long-term path is not as steep as the market had initially priced in, thus recalibrating the opportunity cost of holding non-yielding metals.How does the retracement of energy premiums correlate with interest rate logic?
This rebound in silver prices is not solely due to interest rate events. Before and after the Fed's decision, Brent crude oil traded above $108 per barrel. Following this, crude oil prices fell for three consecutive trading days, and Brent crude is currently trading in the $102-$103 per barrel range, still at a high level, but some risk premium has already been priced in. The 10-year US Treasury yield has fallen from 5.04% to 4.95%. Lower oil prices have reduced the pricing of a further acceleration in inflation, and the yield retracement directly lowers the holding cost of silver. Geopolitically, during the UN General Assembly cycle, the US arranged meetings with Gulf leaders to discuss the aftermath of the Middle East conflict, and a core Iranian delegation was allowed to attend high-level meetings. This does not mean the conflict is over; it simply means the market is beginning to trade on an increased probability of de-escalation. As long as energy prices fall from extreme premiums, the tail risk on the interest rate path will contract accordingly, and silver will simultaneously benefit from reduced real interest rate pressure and improved expectations for industrial costs. However, regional clashes and shipping disruptions persist, oil prices remain above $100 per barrel, and the risk of further inflationary acceleration has not disappeared; it has simply shifted from one-sided pricing to two-way competition.Physical shortages and industrial attributes constitute another pricing axis.
Interest rates explain short-term fluctuations, while physical balance explains why silver is more responsive to macroeconomic impulses. The framework provided by the Silver Institute and research institutions in their 2026 World Silver Survey is as follows: Global demand in 2026 is approximately 1.1126 billion ounces, while supply is approximately 1.0664 billion ounces, resulting in a deficit of approximately 46.3 million ounces, marking the sixth consecutive year of shortage. The deficit in 2025 was approximately 40.3 million ounces, and since 2021, accumulated inventory withdrawals have reached approximately 762.1 million ounces, nearly equivalent to a year's worth of mining production. Mining production is roughly flat, and while recycling has recovered with prices, it is unlikely to fill the gap all at once. Structurally, industrial demand is projected at approximately 639.6 million ounces, a year-on-year decrease of about 3%, with photovoltaic usage expected to decline by about 19%, partially offset by data centers, power grids, and transportation electrification. Jewelry and silverware are suppressed by high prices, while demand for investment-grade silver bars and coins has rebounded. Therefore, silver is simultaneously driven by three axes: interest rates, energy inflation expectations, and industrial inventories. When interest rates ease slightly and oil prices retreat, industrial factors won't immediately rewrite the annual balance, but they will change the market's discounting of the rate of inventory depletion. This is the microeconomic basis for silver prices to recover quickly after the decision, even though interest rates haven't eased.Price Structure and Follow-up Watchlist
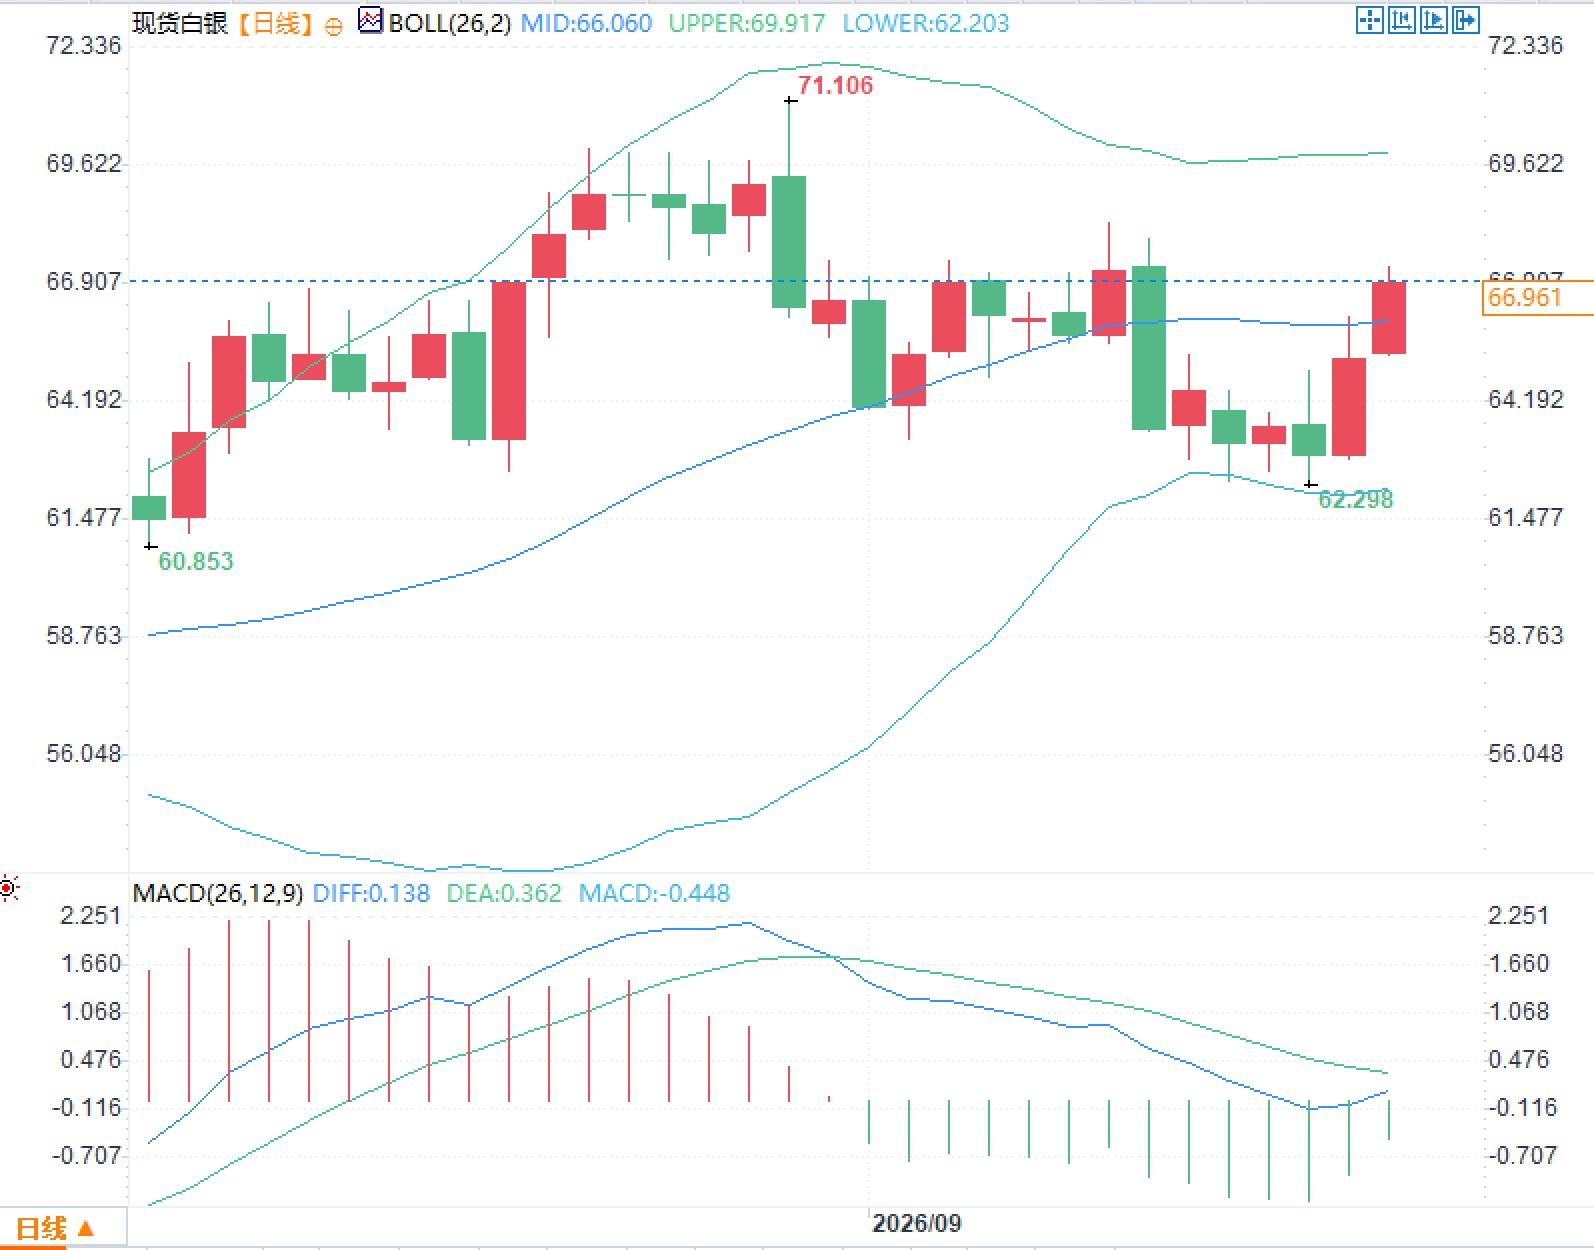
From a daily chart perspective, spot silver experienced a rapid return from near the lower Bollinger Band to the middle band before and after this recent price surge. The middle Bollinger Band is around $66.06/oz, the upper band is around $69.92/oz, and the lower band is around $62.20/oz. After rebounding from a low of around $60.85/oz, the price touched around $71.11/oz, subsequently fluctuating around the middle band. The MACD shows a DIFF of approximately 0.138, a DEA of approximately 0.362, and a histogram of approximately -0.448. The histogram remains below the zero line, but the DIFF has risen from its low. The market is likely to focus on three sets of information going forward: First, whether subsequent US inflation and employment trends will strengthen or weaken the median of the dot plot's "another increase in 2026, no change in 2027"; second, whether crude oil can continue to retreat from above $100/barrel, thereby changing the slope of the energy component in the PCE; and third, whether physical lease rates, exchange inventories, and industrial orders show that the gap is accelerating or being suppressed by high prices. Once positions are crowded, even if the data shows only a mild deviation, silver's elasticity will be greater than most industrial metals.
- Risk Warning and Disclaimer
- The market involves risk, and trading may not be suitable for all investors. This article is for reference only and does not constitute personal investment advice, nor does it take into account certain users’ specific investment objectives, financial situation, or other needs. Any investment decisions made based on this information are at your own risk.