Gold Outlook: Depends on shifts in oil prices and Fed expectations
2026-09-19 00:12:10
On Friday (September 18), during the US trading session, spot gold's upward momentum faded after touching the $4,400 mark. Expectations of a hawkish Federal Reserve policy led to strong buying of the dollar, while a rebound in oil prices and higher US Treasury yields further pressured gold prices. Spot gold traded around $4,355, up 0.31% on the day. Gold prices have been highly volatile this week. The Federal Reserve raised interest rates by 25 basis points on Wednesday, bringing the rate to a range of 3.75%-4.00%, the first rate hike since 2023. This decision pushed the dollar and US Treasury yields higher, and gold briefly fell to $4,235, a new low in over a month. The US Dollar Index (DXY), which measures the dollar against six major currencies, is currently trading around 100.40, near a seven-week high.  However, the downward pressure on gold prices from the Fed's decision was partially offset by the decline in oil prices. Reports indicate that Saudi Arabia is adjusting some of its crude oil export routes and repairing the East-West oil pipeline damaged in last week's attack. This pipeline would allow Saudi crude oil to bypass the Strait of Hormuz and be transported directly to the Red Sea. What will be the future direction of gold? The Fed signaled that policymakers are committed to bringing inflation back to the 2% target, and further interest rate hikes are possible in the future. The updated dot plot shows that 16 of the 18 Fed officials expect at least one more rate hike this year. The median policy rate forecast for 2026 and 2027 is 4.1%, meaning officials do not expect a rate cut next year. Higher borrowing costs will increase the opportunity cost of holding non-interest-bearing assets like gold. According to the CME FedWatch Tool, current market expectations indicate a 55% probability of another rate hike at the October meeting. Meanwhile, the inflation risk from energy remains a major concern for the market. WTI crude oil rebounded from its intraday low of $94.63 and is currently trading around $96.68. Restricted shipping in the Strait of Hormuz offset the positive impact of restored Saudi oil supply. These risks have kept US Treasury yields high, after limited previous declines. The benchmark 10-year Treasury yield is around 5.00%, up more than 1% intraday, not far from the 2007 high of $5.04. The overall environment is challenging for gold. For gold prices to see a strong rebound, further declines in oil prices, a drop in US Treasury yields, or a shift in market expectations regarding Fed rate hikes are needed. Even so, continued central bank gold purchases, strong investment demand, and continued inflows into gold ETFs will provide long-term support for gold prices. Key Focus Next Week The US economic data calendar next week is relatively light, but several Fed officials will deliver public speeches. Their statements will provide new clues as to whether there will be another rate hike in October. Developments in the Middle East are also worth close attention. US President Trump is expected to meet with leaders or foreign ministers of the Gulf Cooperation Council countries on Tuesday during the UN General Assembly. Technical analysis: Spot gold is consolidating below the middle Bollinger Band.
 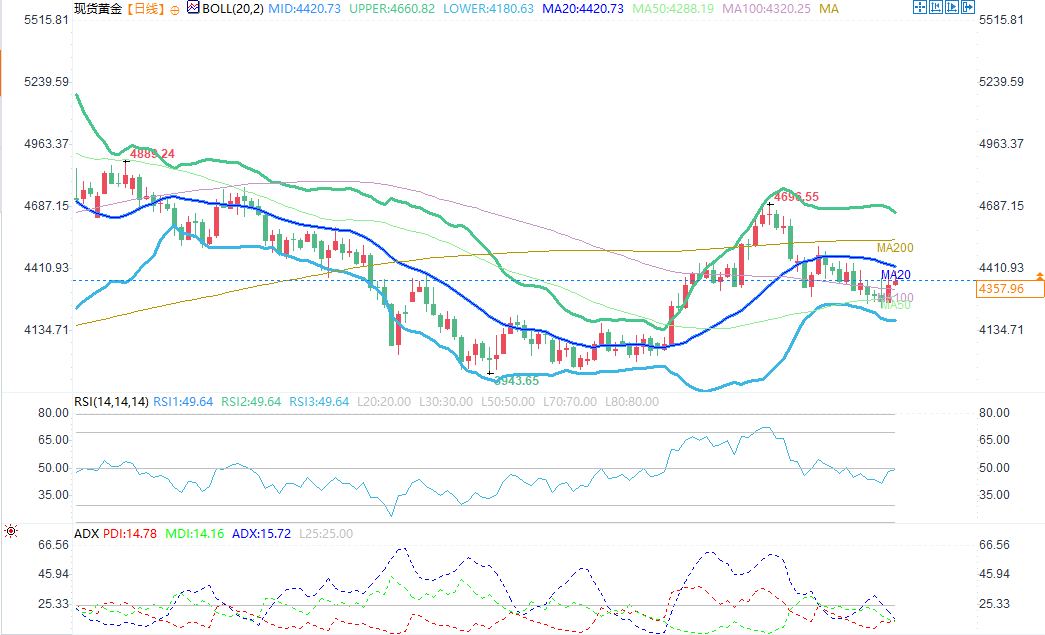 (Spot gold daily chart source: EasyTrade) On the daily chart, spot gold is trading below the 20-period Bollinger Band middle line at 4420.74, with the current price at 4358.31, indicating a weak and volatile short-term trend. Indicator signals are diverging: the ADX value is 15.72, below 25, indicating that the current market lacks a strong one-sided trend and the upward momentum continues to weaken; the RSI (14) reading is 49.65, which is near the neutral range, neither overbought nor oversold, indicating that the market is mainly consolidating within a range and there is no clear one-sided direction. Resistance levels: The first resistance is the Bollinger Band middle line at $4420.74; the second is near the previous high at $4500; and the next resistance is the Bollinger Band upper line at $4660.82. Support levels: The first support is the Bollinger Band lower line at $4180.66; the more critical horizontal support is at $4000. If the gold price falls deeply to this level, it is expected to attract a large number of bargain hunters.
However, the downward pressure on gold prices from the Fed's decision was partially offset by the decline in oil prices. Reports indicate that Saudi Arabia is adjusting some of its crude oil export routes and repairing the East-West oil pipeline damaged in last week's attack. This pipeline would allow Saudi crude oil to bypass the Strait of Hormuz and be transported directly to the Red Sea. What will be the future direction of gold? The Fed signaled that policymakers are committed to bringing inflation back to the 2% target, and further interest rate hikes are possible in the future. The updated dot plot shows that 16 of the 18 Fed officials expect at least one more rate hike this year. The median policy rate forecast for 2026 and 2027 is 4.1%, meaning officials do not expect a rate cut next year. Higher borrowing costs will increase the opportunity cost of holding non-interest-bearing assets like gold. According to the CME FedWatch Tool, current market expectations indicate a 55% probability of another rate hike at the October meeting. Meanwhile, the inflation risk from energy remains a major concern for the market. WTI crude oil rebounded from its intraday low of $94.63 and is currently trading around $96.68. Restricted shipping in the Strait of Hormuz offset the positive impact of restored Saudi oil supply. These risks have kept US Treasury yields high, after limited previous declines. The benchmark 10-year Treasury yield is around 5.00%, up more than 1% intraday, not far from the 2007 high of $5.04. The overall environment is challenging for gold. For gold prices to see a strong rebound, further declines in oil prices, a drop in US Treasury yields, or a shift in market expectations regarding Fed rate hikes are needed. Even so, continued central bank gold purchases, strong investment demand, and continued inflows into gold ETFs will provide long-term support for gold prices. Key Focus Next Week The US economic data calendar next week is relatively light, but several Fed officials will deliver public speeches. Their statements will provide new clues as to whether there will be another rate hike in October. Developments in the Middle East are also worth close attention. US President Trump is expected to meet with leaders or foreign ministers of the Gulf Cooperation Council countries on Tuesday during the UN General Assembly. Technical analysis: Spot gold is consolidating below the middle Bollinger Band. (Spot gold daily chart source: EasyTrade) On the daily chart, spot gold is trading below the 20-period Bollinger Band middle line at 4420.74, with the current price at 4358.31, indicating a weak and volatile short-term trend. Indicator signals are diverging: the ADX value is 15.72, below 25, indicating that the current market lacks a strong one-sided trend and the upward momentum continues to weaken; the RSI (14) reading is 49.65, which is near the neutral range, neither overbought nor oversold, indicating that the market is mainly consolidating within a range and there is no clear one-sided direction. Resistance levels: The first resistance is the Bollinger Band middle line at $4420.74; the second is near the previous high at $4500; and the next resistance is the Bollinger Band upper line at $4660.82. Support levels: The first support is the Bollinger Band lower line at $4180.66; the more critical horizontal support is at $4000. If the gold price falls deeply to this level, it is expected to attract a large number of bargain hunters.- Risk Warning and Disclaimer
- The market involves risk, and trading may not be suitable for all investors. This article is for reference only and does not constitute personal investment advice, nor does it take into account certain users’ specific investment objectives, financial situation, or other needs. Any investment decisions made based on this information are at your own risk.