Gold remains range-bound, awaiting a directional move.
2026-09-22 09:44:12
Spot gold weakened in early Asian trading on Tuesday, with XAU/USD falling back to around $4355, ending a two-day winning streak. A market reassessment of the Federal Reserve's interest rate path was the main factor weighing on gold. Last week, the Fed raised its policy rate by 25 basis points to a range of 3.75% to 4.00%, and recent official comments indicate that policymakers have not completely ruled out further rate hikes. This supported the dollar and US Treasury yields, while non-yielding gold faced some pressure.  Federal Reserve policy expectations are becoming a key variable in the short-term movement of gold. St. Louis Fed President Alberto Musaleem stated on Monday that if inflation continues to exceed the target, monetary policy may still need further tightening. He also pointed out that the stimulative effect of US monetary policy on the economy may not have fully faded after this month's rate hike. This statement reinforced market expectations of "higher interest rates lasting longer," increasing the opportunity cost of holding gold. According to the CME Group's FedWatch tool, the market currently expects a 90.3% probability of another Fed rate hike in December. This expectation significantly strengthens the dollar's interest rate advantage. If more Fed officials continue to emphasize inflation risks, the dollar index and US Treasury yields may remain relatively strong, limiting the short-term upside potential for gold. From an inflation structure perspective, the market's focus has expanded from simple energy price shocks to demand-side pressures. Musaleem believes that inflation is still affected by strong demand and commodity price shocks beyond energy, and the underlying inflation level remains high. This means that even if some energy supply concerns ease, the rate of inflation decline may still be slower than policymakers expect, thus allowing the Fed to maintain a tight policy stance. However, gold is not entirely lacking in fundamental support. Improved expectations for Middle East diplomacy and easing concerns about energy supply may reduce some safe-haven demand for gold, but if new geopolitical developments occur, safe-haven demand for gold could rebound rapidly. Furthermore, gold ETF holdings are currently at a six-month high, and continued gold purchases by global central banks also support medium- to long-term gold demand. Against the backdrop of a strengthening US dollar, these factors help limit the downside for gold prices. Currently, the gold market exhibits a clear tug-of-war between bulls and bears. On one hand, hawkish signals from the Federal Reserve, a stronger dollar, and rising real interest rate expectations put pressure on gold prices; on the other hand, central bank gold purchases, ETF funds, and potential safe-haven demand still provide bottom support. Going forward, key factors to watch include speeches by Federal Reserve officials, the US dollar index, US Treasury yields, and developments in the Middle East, as these factors may determine whether gold can regain the $4400 mark. From a daily chart perspective, gold has currently retreated to around $4365, slightly below the 20-day Bollinger Band middle line, but still clearly trading above the 100-day simple moving average, therefore the medium-term bullish structure has not been broken. The RSI is around 49.95, in the neutral zone, indicating that the current market is more of a high-level consolidation than an extreme oversold condition. The key short-term support level to watch is $4320, near the 100-day moving average. If this level holds, gold still has a chance to maintain its medium-term bullish consolidation structure. Further downside is around $4200, near the lower Bollinger Band. On the upside, the first resistance level to watch is the middle Bollinger Band around $4405. A break above this level could lead to a test of the upper Bollinger Band around $4615. Looking at the 4-hour chart, gold prices have recently retreated after a surge, with short-term momentum weakening and the market re-entering a consolidation phase. The area around $4360 is a crucial battleground. If prices can regain a foothold in the $4400-$4405 range, short-term rebound momentum is expected to recover, pushing towards higher resistance levels. Conversely, if $4360 is breached, the $4320 support level needs to be closely monitored. A decisive break below $4320 could extend the short-term correction. Overall, with the US dollar and Federal Reserve interest rate expectations remaining strong, gold will continue to face short-term pressure. However, as long as the support near the 100-day moving average remains effective, the medium-term trend has not yet been significantly disrupted.
 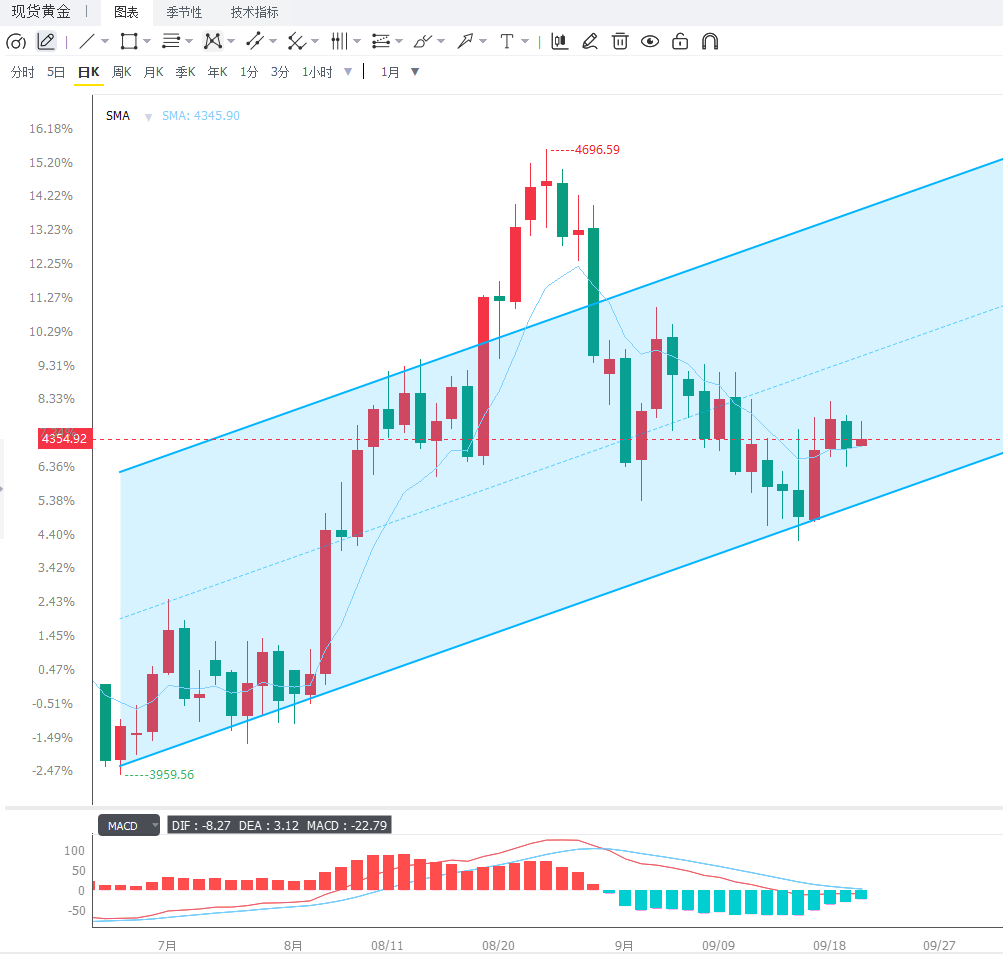 Editor's Summary: Gold is currently in a tug-of-war between expectations of Fed tightening and supportive medium- to long-term demand. Further interest rate hike expectations have intensified pressure on the dollar and interest rates, putting short-term downward pressure on gold prices. However, ETF holdings, central bank gold purchases, and potential safe-haven demand still provide some bottom support. The core variables for the market going forward remain US inflation, Fed officials' statements, and changes in the dollar and US Treasury yields. Technically, $4405 is an important reference point for a short-term resurgence, while $4320 is a key level for judging whether the medium-term structure will weaken further.
Federal Reserve policy expectations are becoming a key variable in the short-term movement of gold. St. Louis Fed President Alberto Musaleem stated on Monday that if inflation continues to exceed the target, monetary policy may still need further tightening. He also pointed out that the stimulative effect of US monetary policy on the economy may not have fully faded after this month's rate hike. This statement reinforced market expectations of "higher interest rates lasting longer," increasing the opportunity cost of holding gold. According to the CME Group's FedWatch tool, the market currently expects a 90.3% probability of another Fed rate hike in December. This expectation significantly strengthens the dollar's interest rate advantage. If more Fed officials continue to emphasize inflation risks, the dollar index and US Treasury yields may remain relatively strong, limiting the short-term upside potential for gold. From an inflation structure perspective, the market's focus has expanded from simple energy price shocks to demand-side pressures. Musaleem believes that inflation is still affected by strong demand and commodity price shocks beyond energy, and the underlying inflation level remains high. This means that even if some energy supply concerns ease, the rate of inflation decline may still be slower than policymakers expect, thus allowing the Fed to maintain a tight policy stance. However, gold is not entirely lacking in fundamental support. Improved expectations for Middle East diplomacy and easing concerns about energy supply may reduce some safe-haven demand for gold, but if new geopolitical developments occur, safe-haven demand for gold could rebound rapidly. Furthermore, gold ETF holdings are currently at a six-month high, and continued gold purchases by global central banks also support medium- to long-term gold demand. Against the backdrop of a strengthening US dollar, these factors help limit the downside for gold prices. Currently, the gold market exhibits a clear tug-of-war between bulls and bears. On one hand, hawkish signals from the Federal Reserve, a stronger dollar, and rising real interest rate expectations put pressure on gold prices; on the other hand, central bank gold purchases, ETF funds, and potential safe-haven demand still provide bottom support. Going forward, key factors to watch include speeches by Federal Reserve officials, the US dollar index, US Treasury yields, and developments in the Middle East, as these factors may determine whether gold can regain the $4400 mark. From a daily chart perspective, gold has currently retreated to around $4365, slightly below the 20-day Bollinger Band middle line, but still clearly trading above the 100-day simple moving average, therefore the medium-term bullish structure has not been broken. The RSI is around 49.95, in the neutral zone, indicating that the current market is more of a high-level consolidation than an extreme oversold condition. The key short-term support level to watch is $4320, near the 100-day moving average. If this level holds, gold still has a chance to maintain its medium-term bullish consolidation structure. Further downside is around $4200, near the lower Bollinger Band. On the upside, the first resistance level to watch is the middle Bollinger Band around $4405. A break above this level could lead to a test of the upper Bollinger Band around $4615. Looking at the 4-hour chart, gold prices have recently retreated after a surge, with short-term momentum weakening and the market re-entering a consolidation phase. The area around $4360 is a crucial battleground. If prices can regain a foothold in the $4400-$4405 range, short-term rebound momentum is expected to recover, pushing towards higher resistance levels. Conversely, if $4360 is breached, the $4320 support level needs to be closely monitored. A decisive break below $4320 could extend the short-term correction. Overall, with the US dollar and Federal Reserve interest rate expectations remaining strong, gold will continue to face short-term pressure. However, as long as the support near the 100-day moving average remains effective, the medium-term trend has not yet been significantly disrupted. Editor's Summary: Gold is currently in a tug-of-war between expectations of Fed tightening and supportive medium- to long-term demand. Further interest rate hike expectations have intensified pressure on the dollar and interest rates, putting short-term downward pressure on gold prices. However, ETF holdings, central bank gold purchases, and potential safe-haven demand still provide some bottom support. The core variables for the market going forward remain US inflation, Fed officials' statements, and changes in the dollar and US Treasury yields. Technically, $4405 is an important reference point for a short-term resurgence, while $4320 is a key level for judging whether the medium-term structure will weaken further.
- Risk Warning and Disclaimer
- The market involves risk, and trading may not be suitable for all investors. This article is for reference only and does not constitute personal investment advice, nor does it take into account certain users’ specific investment objectives, financial situation, or other needs. Any investment decisions made based on this information are at your own risk.