ETF inflows coincide with CTA liquidations: Who is pricing gold?
2026-09-23 21:26:12
On Wednesday, September 23, spot gold fell back to around $4,300 during the US session, a daily decline of about 1.2%. Last week, the Federal Reserve raised the target range for the federal funds rate by 25 basis points to 3.75% to 4.00%, the first rate hike since 2023. The dot plot showed that most members favored at least one more rate hike this year. Richmond Fed President Barkin said on Tuesday that the economic situation "if anything has changed, it's solidified," and cautioned that the tariff and energy shocks have not subsided as expected. The US dollar index was trading around 100.9, and the two-year US Treasury yield was around 4.79%. West Texas Intermediate crude oil hovered around $90, and diplomatic contacts in the Strait of Hormuz have yet to show a verifiable resumption of communication. Gold is simultaneously facing the forces of rising holding costs and the return of official and allocation-oriented funds, with price fluctuations returning to the cross-pricing of interest rates, capital flows, and geopolitical premiums. 
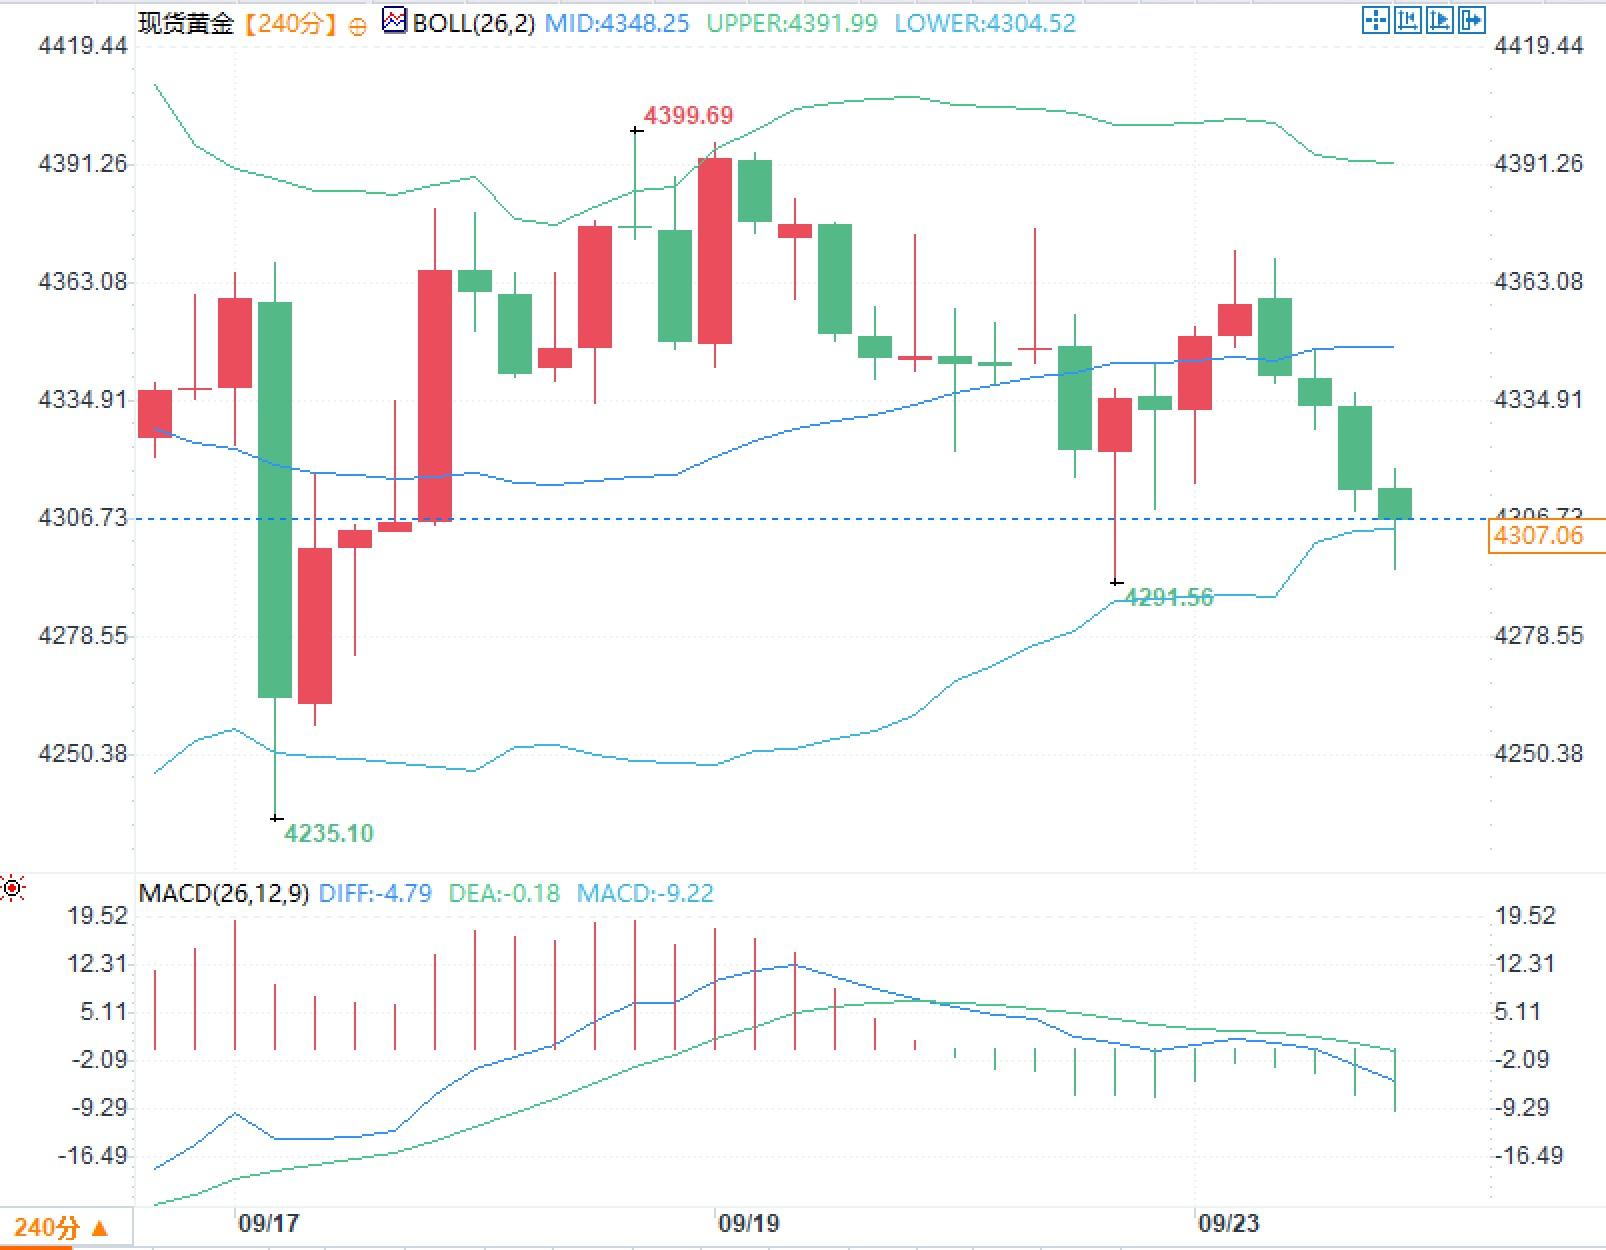 The upper Bollinger Band on the right side is flat and slightly declining, while the lower band is rising. The bandwidth is converging compared to the middle expansion period, indicating that the volatility of this cycle is contracting. The MACD shows that the DIFF is about -4.79, the DEA is about -0.18, and the histogram is about -9.22. The fast and slow lines are below the zero axis, and the histogram is in the negative zone.
How policy interest rate repricing rewrites carrying costs
The short-term pricing of non-interest-bearing assets is primarily determined by real interest rates and dollar liquidity conditions. The Federal Reserve's September 16 statement still described inflation as "high" and stated that this rate hike would help return to the 2% target more quickly. In the dot plot, 16 of the 18 committee members indicated the possibility of at least one more 25-basis-point rate hike this year, with 4 indicating two. Federal funds futures imply a 53% to 54% probability of a rate hike in October. Market disagreement on the path is focused on the timing of this "one more hike," rather than whether the policy direction has shifted towards easing. Barkin made this point more explicit on September 22. He pointed out that inflation has been above target for over five years, with the July personal consumption expenditures price index at 3.7% year-on-year and core inflation at 3.3%, and over 60% of the sub-items still showing year-on-year growth above 3%. He emphasized, "The so-called receding shock has not proven to be temporary or one-off. New tariffs are still emerging, and the Middle East conflict continues." He also warned that the current high inflation carries the risk of seeping into future inflation expectations. The two-year US Treasury yield thus rose to approximately 4.79%, close to the range seen in 2024. For gold, this isn't just a sentimental statement, but a repricing of holding costs: rising short-term real interest rates increase the opportunity cost of holding the non-interest-bearing metal, making short-term pricing more sensitive to the dollar index and interest rate expectations. It's important to consider separately that the policy path has already been partially priced in. TD Securities strategist Ryan McKay wrote, "The market has already priced in more rate hikes. Any failure to deliver on this high threshold will only accelerate gold's upward elasticity." This means that pricing already includes a tighter path, and if subsequent data falls below this path, the discount rate will revert.The time lag between long-term funds, official gold purchases, and system positions
The recent rise in gold prices over the past two years has primarily stemmed from longer-term demand rather than single-day speculative activity. The World Gold Council's 2026 Official Reserves Survey shows that 89% of surveyed central banks believe global official gold reserves will increase in the next 12 months, with 45% planning to increase their holdings—a record high for the survey. 74% of respondents expect the US dollar's share of global reserves to decline over the next five years. Global official net gold purchases in Q2 2026 reached 289 tons, a significant rebound from 57 tons in Q1, bringing the first half of the year to a cumulative 345 tons. McKay summarizes recent changes as a renewed acceleration of inflows from longer-term investors, enabling gold to maintain its resilience in a higher-interest-rate environment. He also points out that systematic trend funds, such as commodity trading advisors, have seen net outflows in recent weeks, reducing their long positions to a limited extent before the September interest rate decision, resulting in relatively clean momentum positions. These two types of funds operate under different stop-loss rules: official and ETF allocations are based on reserve structure, the central level of real interest rates, and fiscal credit, while systematic funds are based on moving average slope and volatility triggers. A common phenomenon before and after interest rate decisions is that the system's trading volume initially flattens the slope, while the allocation volume determines the depth of the pullback. Only by summing these two types of flows can we explain why gold pulls back when interest rates are raised, but doesn't necessarily return to the earlier low-volatility range. A more useful observation is whether these flows can be independently verified: changes in the share of North American and European gold ETFs, London gold vault inventories, and net holdings of futures-managed funds. Flow verification precedes narrative. Any approach that directly translates medium- to long-term research scenarios into current positions misuses the time scale.Fluctuation structure on the four-hour chart
On the 240-minute chart for spot gold, the Bollinger Band middle line is around $4348, the upper line is around $4392, and the lower line is around $4305. The price is trading below the middle line and near the lower line. Within this range, a recent low of $4235 was observed, followed by a high of around $4399 during the subsequent rebound, and another dip near $4291. The upper Bollinger Band on the right side is flat and slightly declining, while the lower band is rising. The bandwidth is converging compared to the middle expansion period, indicating that the volatility of this cycle is contracting. The MACD shows that the DIFF is about -4.79, the DEA is about -0.18, and the histogram is about -9.22. The fast and slow lines are below the zero axis, and the histogram is in the negative zone.The intersection of energy channels, inflation expectations, and metal premiums
West Texas Intermediate crude is trading around $90, while Brent crude is near $100. Both remain significantly above the pre-conflict benchmark of around $72 in February 2026, but have retreated from their recent highs above $100. During the UN General Assembly in New York, US officials held approximately three hours of talks with Iranian representatives. Iranian Foreign Minister Araqchi conveyed to the US envoy conditions for reopening the Strait of Hormuz, including lifting the maritime blockade, unfreezing seized assets, and a ceasefire on all fronts of "resistance." These conditions do not equate to the restoration of the passageway. Shipping tracking shows that merchant ship traffic in the waterway remains far below the pre-conflict level of approximately 100 vessels per day. Lower energy prices will alleviate marginal pressure from imported inflation, but Barkin has broadened the issue from "oil prices alone" to a wider range of price diffusion. As long as core components remain largely above 3%, short-term interest rates are unlikely to be quickly lowered solely by falling oil prices. Gold trades three things simultaneously on this chain: whether the interest rate path is realized, whether official reserve demand continues, and whether the tail risk of energy channel disruption is repriced.- Risk Warning and Disclaimer
- The market involves risk, and trading may not be suitable for all investors. This article is for reference only and does not constitute personal investment advice, nor does it take into account certain users’ specific investment objectives, financial situation, or other needs. Any investment decisions made based on this information are at your own risk.