Gold prices fell below the 50-day moving average support, while a rebound in oil prices pushed up inflationary pressures.
2026-09-24 21:54:12
On Thursday (September 24), spot gold prices weakened slightly during the early US trading session, while spot silver faced more significant pressure. Higher oil prices, high US Treasury yields, and rising market expectations of a Federal Reserve rate hike offset safe-haven buying support from the US-Iran conflict. Spot gold traded around $4271.4 per ounce, down 0.36% on the day; spot silver traded around $63.399, down 1.6% on the day.  The preliminary reading of the S&P Global Composite Purchasing Managers' Index (PMI) for September in the United States came in at 58.4, indicating that business activity accelerated for the fourth consecutive month. Rising energy prices further exacerbated the pressure on business input costs. Meanwhile, initial jobless claims in the US remained below 200,000, demonstrating the resilience of the labor market and supporting the Federal Reserve's hawkish policy pricing. Interest rate futures currently indicate a roughly 70% probability of another 25 basis point rate hike by the Fed in October; the US dollar index remains around 101.276, and the 10-year US Treasury yield is hovering around the 5.1% mark. The US will release new home sales data at 10:00 AM Eastern Time on Thursday; durable goods orders for August will be released at 8:30 AM Eastern Time on Friday; and the final reading of the University of Michigan Consumer Sentiment Index for September will be released at 10:00 AM on Friday. If housing and durable goods orders data are stronger than expected, or if inflation expectations rise, yields and the US dollar will continue to put downward pressure on gold prices; if the data falls short of expectations, the market will re-examine whether the current sell-off in precious metals has over-priced in the Fed's tightening path. With little progress in US-Iran negotiations, the risk premium from the Strait of Hormuz has returned to the oil market. Iran is assessing the US response to a proposal whose core demands are lifting the US maritime blockade of Iranian ports and reopening the Strait of Hormuz. Iranian security officials have stated that the strait will only reopen if the US meets Iran's conditions. Brent crude is trading around $105.42 per barrel, while West Texas Intermediate (WTI) crude is at $94.21 per barrel. The rebound in oil prices has exacerbated upward pressure on inflation, pushing up US Treasury yields. Gold continues to be supported by geopolitical tensions, but the current market transmission logic is mainly driven by oil prices, inflation expectations, US Treasury bonds, and the US dollar. Before the US stock market opened, risk aversion prevailed in global stock markets. Wall Street stock index futures fell due to rising energy prices, uncertainty in the Middle East, and the US-China summit. The previously leading artificial intelligence sector weakened pre-market; the airline and cruise sectors also declined under pressure due to the impact of rising oil prices. Gold Technical Analysis : The next upside target for gold bulls is to push the price back above the resistance zone of $4312.07-$4319.60. Once it holds above this zone, the next target is $4347.26, with a further target of $4399.67.
 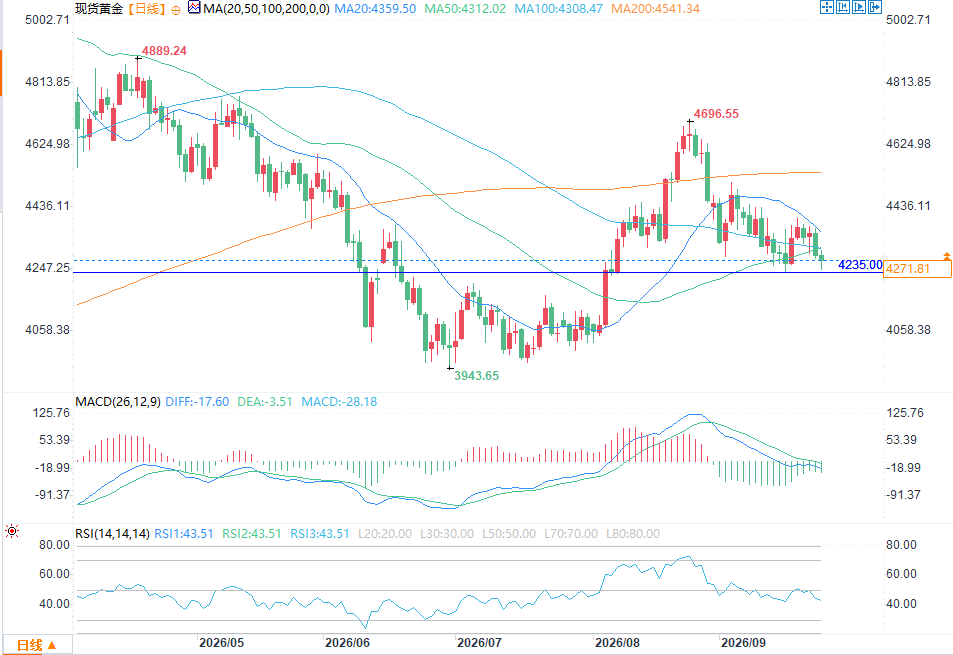 (Spot Gold Daily Chart Source: FX678) Short-term downside target for bears: A break below $4235.17 support, with further support at $4230.51, and then $3996.06. First resistance level: $4312.07, second resistance level: $4319.60; First support level: $4235.17, second support level: $4230.51. Silver Technical Analysis Next upside target for silver bulls: Pushing the price above the $66.4745-$68.6390 range, with a target of $71.9215 and the psychological level of $72.000 after a breakout.
 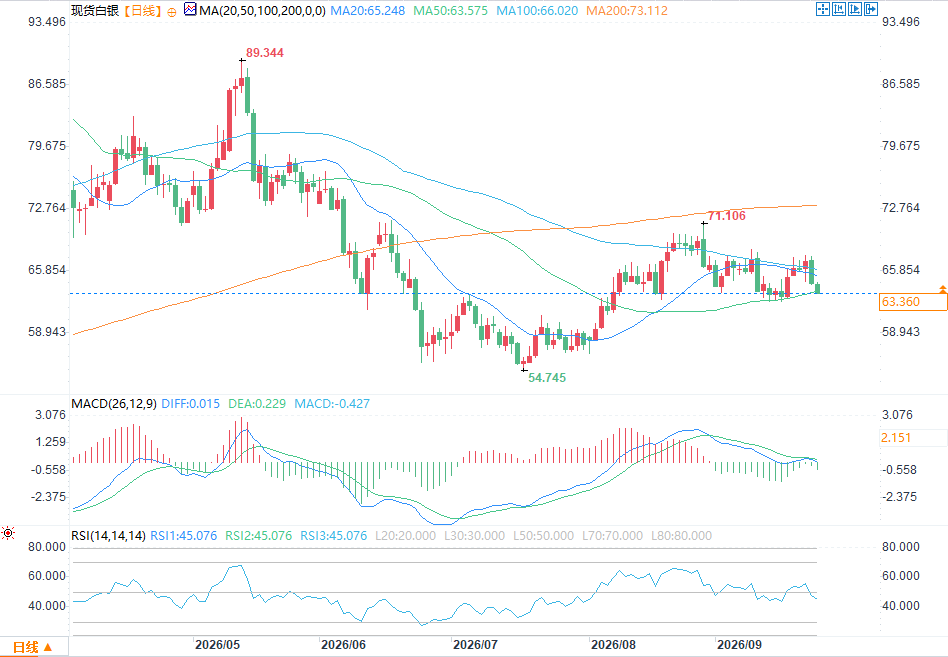 (Spot silver daily chart source: FX678) Downside targets: A break below $63.1920 would target $62.0740, with deeper downside targets in the $60.000-$58.7915 range. First resistance level: $66.4745; second resistance level: $68.6390. First support level: $63.1920; second support level: $62.0740.
The preliminary reading of the S&P Global Composite Purchasing Managers' Index (PMI) for September in the United States came in at 58.4, indicating that business activity accelerated for the fourth consecutive month. Rising energy prices further exacerbated the pressure on business input costs. Meanwhile, initial jobless claims in the US remained below 200,000, demonstrating the resilience of the labor market and supporting the Federal Reserve's hawkish policy pricing. Interest rate futures currently indicate a roughly 70% probability of another 25 basis point rate hike by the Fed in October; the US dollar index remains around 101.276, and the 10-year US Treasury yield is hovering around the 5.1% mark. The US will release new home sales data at 10:00 AM Eastern Time on Thursday; durable goods orders for August will be released at 8:30 AM Eastern Time on Friday; and the final reading of the University of Michigan Consumer Sentiment Index for September will be released at 10:00 AM on Friday. If housing and durable goods orders data are stronger than expected, or if inflation expectations rise, yields and the US dollar will continue to put downward pressure on gold prices; if the data falls short of expectations, the market will re-examine whether the current sell-off in precious metals has over-priced in the Fed's tightening path. With little progress in US-Iran negotiations, the risk premium from the Strait of Hormuz has returned to the oil market. Iran is assessing the US response to a proposal whose core demands are lifting the US maritime blockade of Iranian ports and reopening the Strait of Hormuz. Iranian security officials have stated that the strait will only reopen if the US meets Iran's conditions. Brent crude is trading around $105.42 per barrel, while West Texas Intermediate (WTI) crude is at $94.21 per barrel. The rebound in oil prices has exacerbated upward pressure on inflation, pushing up US Treasury yields. Gold continues to be supported by geopolitical tensions, but the current market transmission logic is mainly driven by oil prices, inflation expectations, US Treasury bonds, and the US dollar. Before the US stock market opened, risk aversion prevailed in global stock markets. Wall Street stock index futures fell due to rising energy prices, uncertainty in the Middle East, and the US-China summit. The previously leading artificial intelligence sector weakened pre-market; the airline and cruise sectors also declined under pressure due to the impact of rising oil prices. Gold Technical Analysis : The next upside target for gold bulls is to push the price back above the resistance zone of $4312.07-$4319.60. Once it holds above this zone, the next target is $4347.26, with a further target of $4399.67. (Spot Gold Daily Chart Source: FX678) Short-term downside target for bears: A break below $4235.17 support, with further support at $4230.51, and then $3996.06. First resistance level: $4312.07, second resistance level: $4319.60; First support level: $4235.17, second support level: $4230.51. Silver Technical Analysis Next upside target for silver bulls: Pushing the price above the $66.4745-$68.6390 range, with a target of $71.9215 and the psychological level of $72.000 after a breakout. (Spot silver daily chart source: FX678) Downside targets: A break below $63.1920 would target $62.0740, with deeper downside targets in the $60.000-$58.7915 range. First resistance level: $66.4745; second resistance level: $68.6390. First support level: $63.1920; second support level: $62.0740.
- Risk Warning and Disclaimer
- The market involves risk, and trading may not be suitable for all investors. This article is for reference only and does not constitute personal investment advice, nor does it take into account certain users’ specific investment objectives, financial situation, or other needs. Any investment decisions made based on this information are at your own risk.