Precious metals sell-off: Hormuz stalemate pushes up US Treasury yields and the dollar.
2026-09-28 21:52:17
On Monday (September 28), spot gold and silver prices fell sharply during the early US trading session. A rebound in oil prices reinforced the inflation narrative, further fueling market expectations of another Federal Reserve interest rate hike. Spot gold traded around $4150 per ounce, down 3.16% on the day; spot silver traded around $61.504 per ounce, down 4.36% on the day.  Influenced by stronger US economic activity data, solidified inflation expectations, and renewed rises in energy prices, US Treasury yields, highly sensitive to policy, rose, and market pricing shifted back towards expectations of "high interest rates lasting longer." Traders currently estimate a 68%-70% probability of another Fed rate hike in October; the US dollar index is hovering around 101, and the 10-year US Treasury yield exceeds 5.2%. This week's data schedule is packed: Tuesday at 10:00 AM ET, the JOLTS job openings data will be released; Wednesday, ADP private sector employment data and August PCE inflation data will be released; Thursday, the ISM manufacturing index will be released; and Friday, the September non-farm payrolls report will be released. If inflation or labor market data is stronger than expected, US Treasury yields and the dollar will continue to rise, thus suppressing gold prices; if the data is weaker, it will verify whether Monday's drop below $4200 in gold prices was an overreaction. The Strait of Hormuz and the US-Iran situation have once again become the core focus of cross-asset trading. US President Trump rejected Iran's proposal to reopen the Strait and end the conflict, and negotiations have stalled, but further consultations are expected this week. Brent crude rebounded more than 1.7%, reaching approximately $99.13 per barrel; West Texas Intermediate (WTI) crude was near $94.31 per barrel. The surge in oil prices fueled inflation concerns, prompting the market to revise its expectations for a Federal Reserve rate hike. The bullish and bearish logic for gold has diverged: geopolitical risks have driven safe-haven buying, but higher oil prices have pushed up yields and the dollar, increasing the opportunity cost of holding non-interest-bearing precious metals. Gold Technical Analysis
 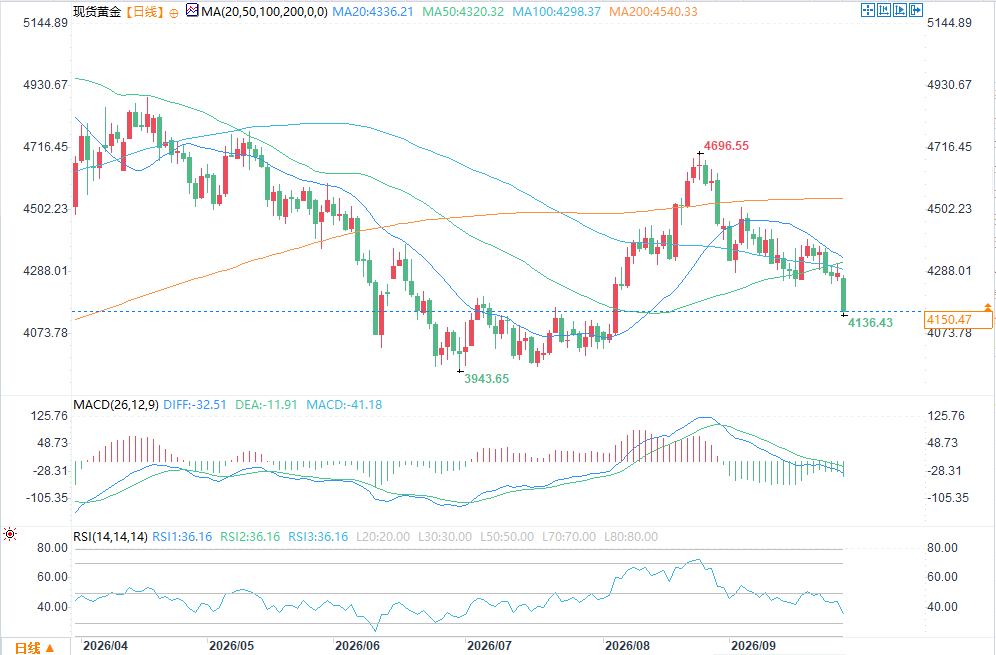 The next upside target for spot gold bulls is to push prices back into the $4199.00-$4223.90 resistance zone; a break above this zone would target $4244.00, followed by $4257.00. The short-term downside target for bears is a break below $4162.69; further downside targets are $4152.00, followed by $4128.00. First resistance is $4199.00, followed by $4223.90; first support is $4162.69, followed by $4152.00. Silver Technical Analysis
 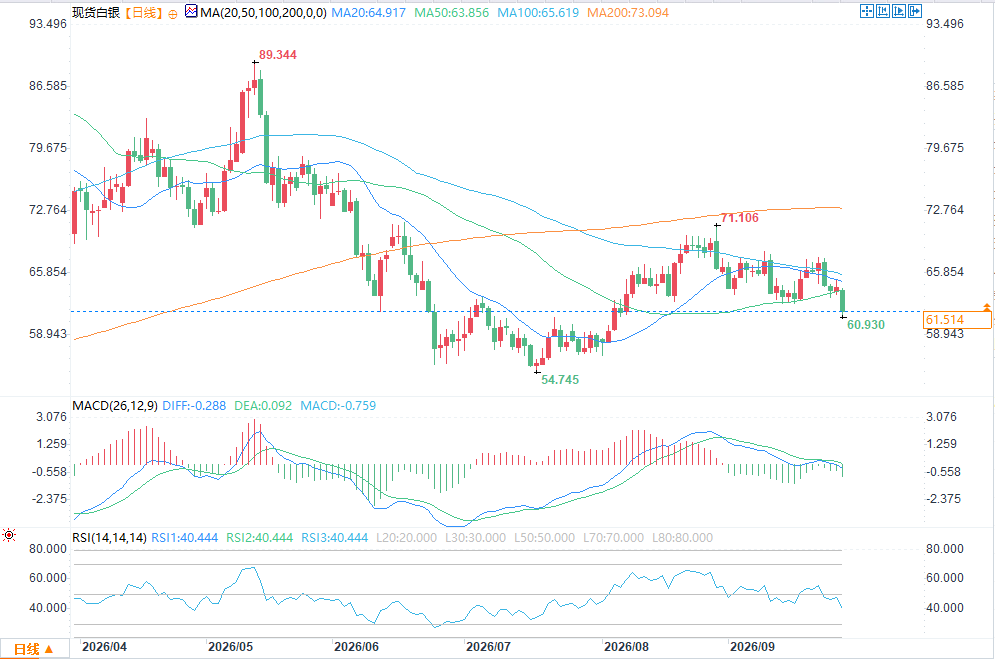 The next upside target for spot silver bulls is to push prices back into the $62.350-$63.150 range; a break above this range would target $64.080, then $64.820. The short-term downside target for bears is a break below $60.890; a further downside target is $60.830, followed by the psychological level of $60.000. First resistance is at $62.350, followed by $63.150; first support is at $60.890, followed by $60.830.
Influenced by stronger US economic activity data, solidified inflation expectations, and renewed rises in energy prices, US Treasury yields, highly sensitive to policy, rose, and market pricing shifted back towards expectations of "high interest rates lasting longer." Traders currently estimate a 68%-70% probability of another Fed rate hike in October; the US dollar index is hovering around 101, and the 10-year US Treasury yield exceeds 5.2%. This week's data schedule is packed: Tuesday at 10:00 AM ET, the JOLTS job openings data will be released; Wednesday, ADP private sector employment data and August PCE inflation data will be released; Thursday, the ISM manufacturing index will be released; and Friday, the September non-farm payrolls report will be released. If inflation or labor market data is stronger than expected, US Treasury yields and the dollar will continue to rise, thus suppressing gold prices; if the data is weaker, it will verify whether Monday's drop below $4200 in gold prices was an overreaction. The Strait of Hormuz and the US-Iran situation have once again become the core focus of cross-asset trading. US President Trump rejected Iran's proposal to reopen the Strait and end the conflict, and negotiations have stalled, but further consultations are expected this week. Brent crude rebounded more than 1.7%, reaching approximately $99.13 per barrel; West Texas Intermediate (WTI) crude was near $94.31 per barrel. The surge in oil prices fueled inflation concerns, prompting the market to revise its expectations for a Federal Reserve rate hike. The bullish and bearish logic for gold has diverged: geopolitical risks have driven safe-haven buying, but higher oil prices have pushed up yields and the dollar, increasing the opportunity cost of holding non-interest-bearing precious metals. Gold Technical Analysis The next upside target for spot gold bulls is to push prices back into the $4199.00-$4223.90 resistance zone; a break above this zone would target $4244.00, followed by $4257.00. The short-term downside target for bears is a break below $4162.69; further downside targets are $4152.00, followed by $4128.00. First resistance is $4199.00, followed by $4223.90; first support is $4162.69, followed by $4152.00. Silver Technical Analysis The next upside target for spot silver bulls is to push prices back into the $62.350-$63.150 range; a break above this range would target $64.080, then $64.820. The short-term downside target for bears is a break below $60.890; a further downside target is $60.830, followed by the psychological level of $60.000. First resistance is at $62.350, followed by $63.150; first support is at $60.890, followed by $60.830.
- Risk Warning and Disclaimer
- The market involves risk, and trading may not be suitable for all investors. This article is for reference only and does not constitute personal investment advice, nor does it take into account certain users’ specific investment objectives, financial situation, or other needs. Any investment decisions made based on this information are at your own risk.