Gold prices stabilized after a sharp drop as traders weighed the Federal Reserve's policy outlook against Middle East geopolitical risks.
2026-09-29 23:48:15
On Tuesday (September 29), spot gold rebounded after a sharp sell-off earlier this week. This rise is a corrective rebound, with the market's main driver still revolving around expectations of further interest rate hikes by the Federal Reserve. Spot gold traded around $4156.42 during the session, up 1.02% on the day.  Precious metal prices plunged nearly 4% on Monday, hitting a low of $4,110, the lowest level since August 5. The decline was triggered by rising US Treasury yields to multi-year highs, increasing the opportunity cost of holding non-interest-bearing gold. The yield on the benchmark 10-year US Treasury note remained around 5.23%, slightly lower than Monday's high of 5.27%, the highest since 2007. The recent bond sell-off is largely due to heightened inflation concerns; the standoff between the US and Iran over the Strait of Hormuz has pushed up oil prices. Latest news indicates that Iranian Foreign Minister Abbas Araqchi stated that Tehran is holding indirect negotiations with the US in New York through Qatari mediators. Iran is awaiting a formal response from the US regarding its proposal to reopen the Strait of Hormuz. Meanwhile, US President Trump denied reports from Axios and CNN that the US government had offered Iran a plan to lift sanctions and unfreeze frozen assets. Trump stated that the US has not made any concessions to Iran to end the conflict. Significant differences remain between the two sides on core issues, with Iran emphasizing that it will not lower its negotiating conditions. The conflict has entered its eighth month, with limited progress in negotiations, meaning the disturbances around the Strait of Hormuz may continue for much longer. Against this backdrop, the market expects the Federal Reserve to raise interest rates further after its 25 basis point hike earlier this month. According to the CME FedWatch Tool, market pricing indicates a roughly 72% probability of another rate hike in October. Supported by the Fed's hawkish stance, the US dollar remains strong, currently trading around 101.48, near a two-month high. A stronger dollar increases the cost of buying gold for holders of other currencies. US economic data released on Tuesday fell short of expectations. The Conference Board's September Consumer Confidence Index fell to 81.9, below the market expectation of 89.0; the August figure was also revised down from 89.4 to 88.6. Additionally, JOLTS job openings fell to 7.079 million in August, below the market expectation of 7.23 million; the previous figure was revised up from 7.271 million to 7.335 million. The market will now focus on the Personal Consumption Expenditures (PCE) price index, the ISM Manufacturing Purchasing Managers' Index (PMI), and the non-farm payrolls report, seeking clues about the Federal Reserve's next policy move. Technical Analysis: The RSI is approaching oversold levels, indicating that bears still dominate the market.
 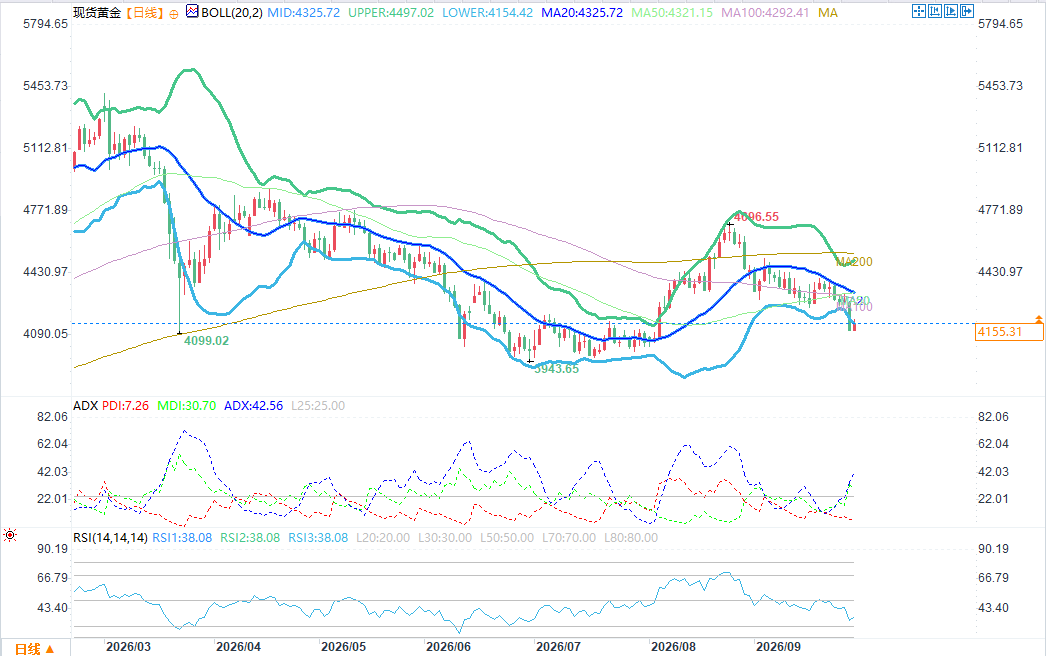 From the daily chart, spot gold is currently in a short-term downtrend, with prices pressured below the upper, middle, and lower Bollinger Bands. Momentum indicators further confirm the downside risk: the 14-period Relative Strength Index (RSI) is at 39, just above the oversold zone; the MACD (Moving Average Convergence Divergence) continues to operate in negative territory, indicating persistent selling pressure; although the ADX (Average Directional Index) is only 18, reflecting a weak current trend. On the upside, the first resistance level is the lower Bollinger Band at approximately $4157; followed by the middle Bollinger Band (SMA) at $4325, and then the upper Bollinger Band at $4494. Gold needs to break through this resistance level to alleviate the current bearish dominance. On the downside, the $4100 and $4000 levels form important support. A break below these levels would trigger a deeper correction; holding these support levels could trigger short covering, with prices testing the nearby Bollinger Bands.
Precious metal prices plunged nearly 4% on Monday, hitting a low of $4,110, the lowest level since August 5. The decline was triggered by rising US Treasury yields to multi-year highs, increasing the opportunity cost of holding non-interest-bearing gold. The yield on the benchmark 10-year US Treasury note remained around 5.23%, slightly lower than Monday's high of 5.27%, the highest since 2007. The recent bond sell-off is largely due to heightened inflation concerns; the standoff between the US and Iran over the Strait of Hormuz has pushed up oil prices. Latest news indicates that Iranian Foreign Minister Abbas Araqchi stated that Tehran is holding indirect negotiations with the US in New York through Qatari mediators. Iran is awaiting a formal response from the US regarding its proposal to reopen the Strait of Hormuz. Meanwhile, US President Trump denied reports from Axios and CNN that the US government had offered Iran a plan to lift sanctions and unfreeze frozen assets. Trump stated that the US has not made any concessions to Iran to end the conflict. Significant differences remain between the two sides on core issues, with Iran emphasizing that it will not lower its negotiating conditions. The conflict has entered its eighth month, with limited progress in negotiations, meaning the disturbances around the Strait of Hormuz may continue for much longer. Against this backdrop, the market expects the Federal Reserve to raise interest rates further after its 25 basis point hike earlier this month. According to the CME FedWatch Tool, market pricing indicates a roughly 72% probability of another rate hike in October. Supported by the Fed's hawkish stance, the US dollar remains strong, currently trading around 101.48, near a two-month high. A stronger dollar increases the cost of buying gold for holders of other currencies. US economic data released on Tuesday fell short of expectations. The Conference Board's September Consumer Confidence Index fell to 81.9, below the market expectation of 89.0; the August figure was also revised down from 89.4 to 88.6. Additionally, JOLTS job openings fell to 7.079 million in August, below the market expectation of 7.23 million; the previous figure was revised up from 7.271 million to 7.335 million. The market will now focus on the Personal Consumption Expenditures (PCE) price index, the ISM Manufacturing Purchasing Managers' Index (PMI), and the non-farm payrolls report, seeking clues about the Federal Reserve's next policy move. Technical Analysis: The RSI is approaching oversold levels, indicating that bears still dominate the market. From the daily chart, spot gold is currently in a short-term downtrend, with prices pressured below the upper, middle, and lower Bollinger Bands. Momentum indicators further confirm the downside risk: the 14-period Relative Strength Index (RSI) is at 39, just above the oversold zone; the MACD (Moving Average Convergence Divergence) continues to operate in negative territory, indicating persistent selling pressure; although the ADX (Average Directional Index) is only 18, reflecting a weak current trend. On the upside, the first resistance level is the lower Bollinger Band at approximately $4157; followed by the middle Bollinger Band (SMA) at $4325, and then the upper Bollinger Band at $4494. Gold needs to break through this resistance level to alleviate the current bearish dominance. On the downside, the $4100 and $4000 levels form important support. A break below these levels would trigger a deeper correction; holding these support levels could trigger short covering, with prices testing the nearby Bollinger Bands.
- Risk Warning and Disclaimer
- The market involves risk, and trading may not be suitable for all investors. This article is for reference only and does not constitute personal investment advice, nor does it take into account certain users’ specific investment objectives, financial situation, or other needs. Any investment decisions made based on this information are at your own risk.