Gold prices found support around $4,140, while a strong dollar and high yields proved to be obstacles.
2026-10-01 14:07:18
The gold market was cautious during the Asian session on Thursday (October 1st). Spot gold attracted bargain hunters near the $4140 area, rebounding to around $4192.93 per ounce by 13:55, a gain of approximately 0.86%, temporarily halting the previous day's pullback from around $4220, but overall upside potential remained significantly limited. A strong dollar and persistently high US Treasury yields exerted dual pressure, coupled with geopolitical risk premiums, making it difficult for gold bulls to push prices to a more meaningful breakout. The current gold price range largely aligns with the latest market data. During the October 1st trading session, gold touched a low of around $4139 before recovering somewhat, fluctuating roughly between $4139 and $4193, still significantly lower than the previous day's high. Its non-interest-bearing nature puts pressure on gold in a high-interest-rate environment, with investors preferring to hold dollar assets or government bonds for returns. 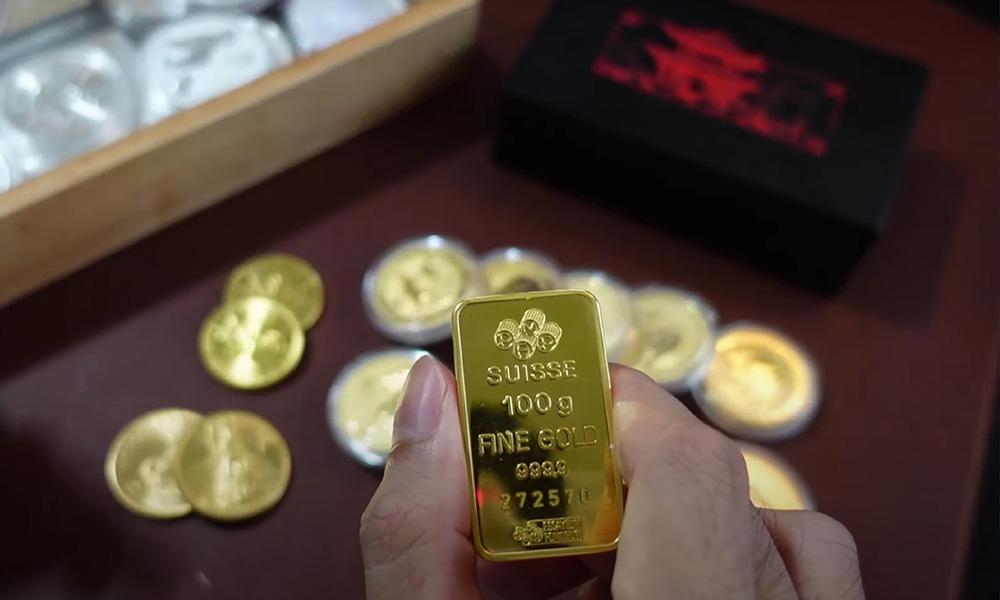
Inflation data eased short-term pressures, but upward revisions to growth data reinforced expectations of tightening.
The U.S. Bureau of Economic Analysis released its August Personal Consumption Expenditures (PCE) price index on Wednesday, showing a 3.4% year-on-year increase, unchanged from the downwardly revised reading of the previous month and below market expectations of 3.7%. Core PCE (excluding food and energy) rose 3.0% year-on-year, also below expectations. Month-on-month, overall PCE rose 0.3%, and core PCE rose 0.2%. This result, coupled with relatively dovish comments from New York Fed President Williams, temporarily eased market concerns about an October rate hike, providing brief support for gold prices. However, the data details were not entirely optimistic. The softening of core goods inflation masked a renewed acceleration in core services and supercore inflation, indicating that underlying price pressures remain. More importantly, the annualized growth rate of U.S. real GDP in the second quarter was revised upward from 1.5% to 2.2%, indicating stronger-than-expected momentum in the second half of the year. Analysts at Societe Generale pointed out that while the inflation revision was slightly favorable, the strengthening of growth momentum makes it more difficult for the Fed to obtain clear policy easing space. The risk of oil-driven inflation persists, and U.S. Treasury yields are near multi-year highs, further supporting the strength of the dollar. According to market pricing tools, traders remain highly priced in the probability of further interest rate hikes by the Federal Reserve before the end of 2026, with over 85% of the likelihood already in their accounts. This puts non-interest-bearing gold under sustained opportunity cost pressure.Geopolitical risks are pushing up the safe-haven dollar, creating significant resistance for gold prices.
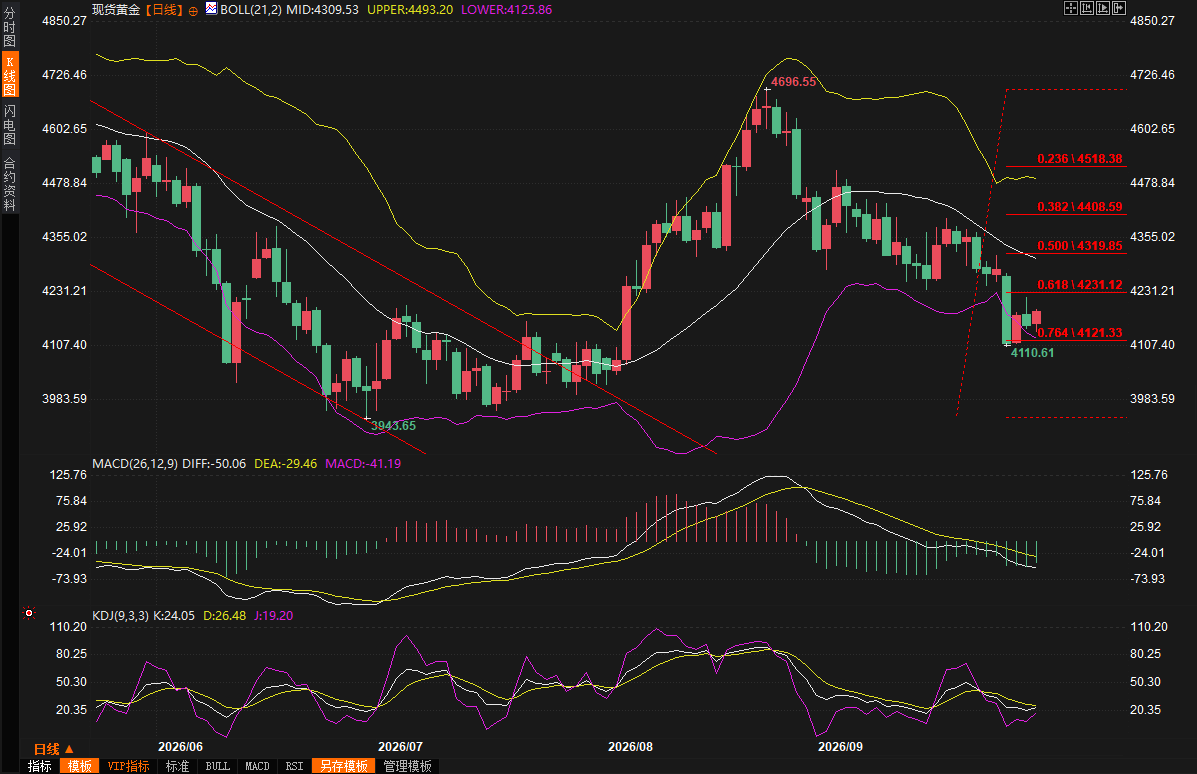
The US-Iran standoff has become an additional supporting factor for the US dollar. Hopes for a diplomatic solution have clearly cooled after President Trump rejected Iran's seven-day peace proposal. The US anticipates a possible resumption of major military operations after the midterm elections, and Secretary of State Rubio demanded the immediate departure of the Iranian delegation, leading to a stalemate in peace talks. These developments have boosted safe-haven demand, causing the US dollar to strengthen against major currencies to its highest level since July 28, directly suppressing gold prices. Technically, gold remains within a downward-sloping parallel channel. The upper boundary of the channel converges with the 100-period simple moving average on the 4-hour chart, forming resistance around $4300. While the MACD indicator has turned positive and the RSI is near 50, indicating a slowdown in downward momentum, the overall structure has not yet reversed. Any rebound may still be seen as a selling opportunity. Key support lies at the lower edge of the channel around $4080; a decisive break below this level could open up further downside potential.The market will focus on employment data and policy signals going forward.
Traders will now focus on the weekly initial jobless claims and ISM manufacturing PMI data released that day, as well as speeches from several influential Federal Reserve officials. Friday's non-farm payroll report will be a key clue in determining the policy path. Meanwhile, any changes in geopolitical news could quickly alter market risk appetite, creating new windows of volatility for gold prices. Overall, gold remains in a tug-of-war between bulls and bears in the short term. Easing inflation data has provided some buffer, but the strong dollar, supported by robust growth, high yields, and geopolitical risks, continues to limit gold's upside potential.Editor's Summary
Gold prices found some support around $4139, but the triple pressure from a strong dollar, high Treasury yields, and geopolitical tensions between the US and Iran made it difficult for gold bulls to effectively break through the upper resistance. While the August PCE year-on-year figures of 3.4% and core PCE of 3.0% were lower than expected, the upward revision of Q2 GDP to 2.2% and the high probability of a year-end rate hike reinforced tightening expectations. Technically, the channel structure and momentum indicators suggest that downward pressure has softened, but a clear reversal signal has not yet formed. The market will need to closely monitor the impact of employment data and geopolitical developments on the correlation between the dollar and gold prices.Frequently Asked Questions
Q: Why has gold struggled to rise significantly despite weaker-than-expected inflation data? A: Although August's PCE growth of 3.4% year-on-year and core growth of 3.0% were lower than market expectations, briefly easing pressure for an October rate hike, the US second-quarter GDP was revised upward from 1.5% to 2.2%, indicating stronger-than-expected economic momentum. Meanwhile, oil-driven inflation risks and high Treasury yields support a strong dollar. As a non-interest-bearing asset, gold's opportunity cost increases in a high-interest-rate environment, thus limiting its rebound. Q: How is the US-Iran situation affecting current gold prices and the dollar's trajectory? A: Trump's rejection of Iran's seven-day peace proposal, his anticipated resumption of military operations after the midterm elections, and Rubio's demand for the Iranian delegation to leave have stalled peace negotiations. Geopolitical risk premiums have pushed the safe-haven dollar to its highest level since July 28, directly offsetting safe-haven demand for gold and putting downward pressure on its price. Q: Where does technical analysis indicate gold's current position? A: XAU/USD is trading within a downward-sloping parallel channel, with the upper boundary converging with the 100-period SMA around $4300, forming resistance. The MACD has turned positive and the RSI is around 50, suggesting a slowdown in downward momentum, but the overall structure remains bearish. Key support lies at $4080; a break below this level could open up further downside potential. Q: How is the market pricing in the probability of a Fed rate hike by the end of the year? A: According to tools such as CME FedWatch, traders still see an over 85% probability of further rate hikes by the Fed before the end of 2026. Although August inflation data eased some short-term pressure, growth momentum and oil price risks keep tightening expectations high, which continues to put downward pressure on gold. Q: What data is most likely to influence gold prices going forward? A: On that day, pay attention to the weekly initial jobless claims and ISM manufacturing PMI, as well as speeches by Fed officials. Friday's non-farm payroll report is a key indicator for judging the job market and policy path. Meanwhile, any geopolitical developments between the US and Iran could quickly alter the relative strength of the dollar and gold. At 14:04 Beijing time, spot gold was trading at $4189.78 per ounce.- Risk Warning and Disclaimer
- The market involves risk, and trading may not be suitable for all investors. This article is for reference only and does not constitute personal investment advice, nor does it take into account certain users’ specific investment objectives, financial situation, or other needs. Any investment decisions made based on this information are at your own risk.