













Recently, oil prices have lost their ability to predict gold prices.
2026-10-07 01:56:17
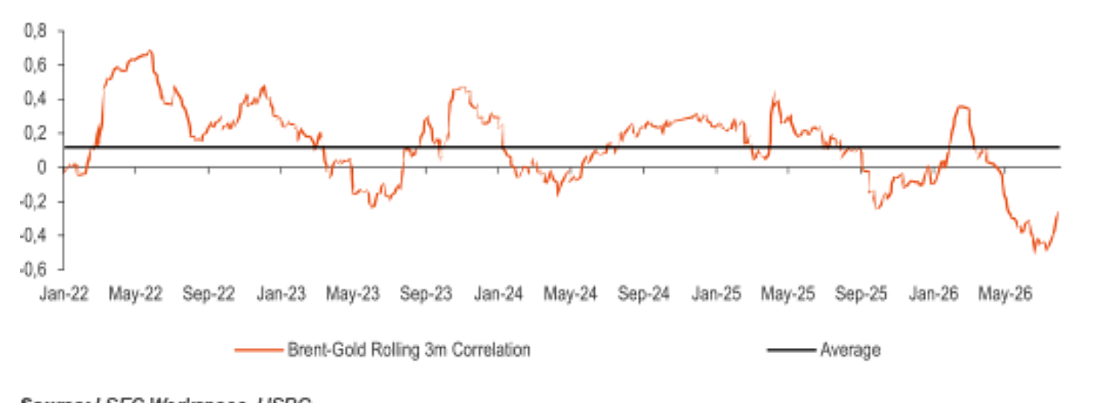
The historical correlation between oil and gold is unstable; after strengthening this year, it has now weakened again. In the 1970s and 80s, the correlation between oil and gold was significant, but today the influence of oil prices on gold is declining, sometimes even showing an inverse effect. Oil prices are not an effective predictor of gold prices; gold prices are more driven by the US dollar and other factors. The correlation between oil and the stock market also indirectly affects gold.  The Link Between Oil and Gold Gold is considered a high-quality safe-haven asset. During periods of escalating geopolitical risk, gold often experiences price increases, allowing investors to diversify their asset allocation and hedge against risk. It is both a commodity and possesses monetary attributes. Due to its safe-haven characteristics, gold is a risk-averse asset, favored by investors when risks intensify. Oil is a core commodity. Oil is a high-risk, pro-cyclical asset with a strong risk appetite, typically rising with economic growth. It also reacts to geopolitical risks, and its price fluctuations spill over into the entire financial market. Oil is a good indicator of global demand, and its price movements often move in tandem with the stock market; higher oil demand often indicates a healthy economy. However, if the price movement is triggered by supply-side shocks—as has been the case for most of this year, with attacks on Iran and the closure of the Strait of Hormuz being examples—rising oil prices will increase inflationary pressures and drag down the stock market. The sharp stock market decline earlier this year was largely due to global market panic triggered by the Iranian conflict, which was exacerbated by soaring oil prices. Most related academic research suggests a significant positive correlation between oil and gold. Specifically, after oil prices fall, gold prices often decline sharply, and vice versa. However, this correlation has weakened. Some academic literature directly states that there is no correlation between the two. However, current academic research does not include the latest price fluctuation data for oil and gold since the outbreak of the recent Iranian conflict. The US dollar is a crucial link between oil and gold. Both assets are priced and traded in US dollars, and historically, they have mostly moved inversely to the dollar. A stronger dollar usually puts downward pressure on gold and oil prices; conversely, a weaker dollar often pushes up gold and oil prices. The relationship between the dollar and gold is particularly complex, influenced by multiple factors: geopolitical situations, inflation expectations, real yields, market investor sentiment, and traditional supply and demand variables such as mineral supply, recycled gold, and jewelry consumption demand. Oil prices are not a reliable predictive indicator . The correlation between gold and oil is complex, dynamic, and asymmetrical. Historically, oil and gold prices have had a strong positive correlation, particularly in the 1970s and 80s, when both assets rose sharply and then fell together. However, this link has clearly weakened. While oil price fluctuations do influence gold prices, the effect is relatively weak. The article "An Analysis of the Volatility and Correlation of Crude Oil and Gold Prices under Socioeconomic Crises" points out that the correlation between Brent crude oil and gold is stronger than that between West Texas Intermediate (WTI) crude oil and gold; the study still concludes that oil prices are poor predictors of gold prices. Looking at a longer timeframe, the correlation between the two fluctuates dramatically. Before and after the outbreak of the Ukraine conflict in 2022, the 3-month rolling correlation coefficient between gold and oil was high. The correlation then weakened, turning negative in late 2023, when gold prices reached $2000/ounce, supported by large-scale gold purchases by central banks. When risk events escalate, central banks continue to buy gold, and oil price volatility narrows, the rolling correlation between the two will periodically turn negative. The 3-month rolling correlation coefficient between Brent crude oil and gold fell from a high of 0.36 on March 1st to -0.5 on July 15th. Despite the escalating US-Iran conflict increasing geopolitical risks and significantly raising oil prices, the correlation coefficient in March plummeted, indicating that the link between the returns of the two asset classes has broken down. Currently, they remain negatively correlated, but the three-month rolling correlation coefficient has converged to -0.11.
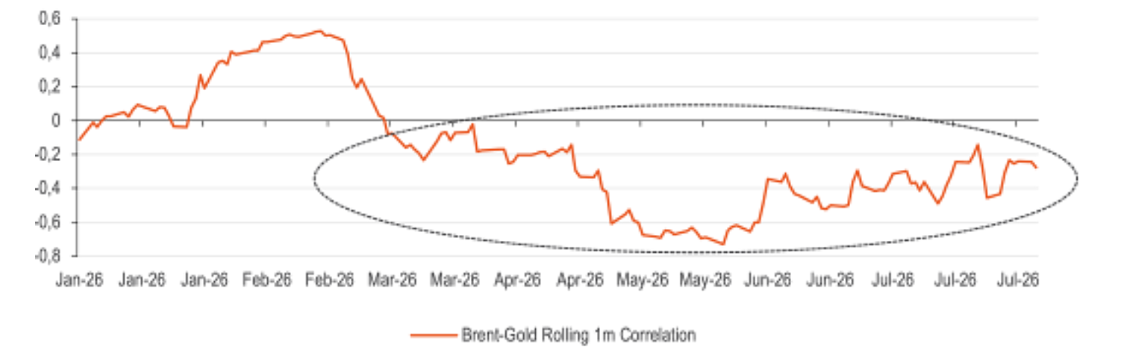
  Shortening the observation period to a one-month high-frequency dimension (see Chart 2 below) reveals that certain trading days significantly alter the overall correlation of returns. Notably, in just two trading days at the beginning of March, the correlation between the two asset classes turned negative. From March 6th (Friday) to March 11th (Tuesday), the one-month rolling correlation coefficient plummeted from a weak positive value of 0.24 to 0.02; the trigger was Monday, March 9th, when Brent crude surged 6.7%, while gold fell 0.6%. Since then, the negative correlation has intensified, reaching a strong negative correlation of -0.72 at the end of May. In the past month, the negative correlation has eased somewhat; both assets rose simultaneously at the end of August, and the correlation coefficient briefly turned positive, but the overall relationship remains negative.
  Another analytical approach is to calculate how many barrels of crude oil are needed to purchase one ounce of gold. Looking back over the past 50 years, for the vast majority of periods, the purchasing power of one ounce of gold was equivalent to 10-30 barrels of Brent crude oil.
 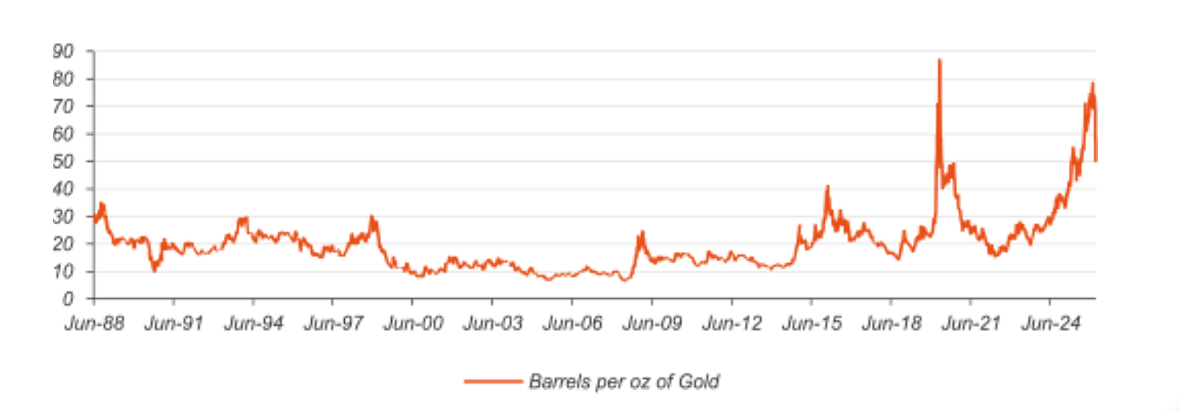 As of August 4, 2026, one ounce of gold can be exchanged for approximately 50 barrels of Brent crude oil. This ratio reached 77 barrels in January of this year, approaching a historical extreme; the last time it reached such a high level was in April 2020 during the COVID-19 pandemic, when Brent crude oil prices plummeted, and the ratio peaked at 87 barrels. We believe that the escalating conflict in the Middle East has strengthened the US dollar, putting downward pressure on gold, while the stock market decline has further triggered gold selling. At the same time, the closure of the Strait of Hormuz and the shutdown of oil production capacity in the Gulf region have pushed up oil prices. The oil-gold correlation exhibits drastically different behavior under different crisis environments; recently, oil prices have lost their ability to predict gold prices. Therefore, we do not recommend considering oil prices as a leading indicator of gold prices. A Complex Web of Correlations This year, oil's impact on the US dollar and stock market has exceeded usual levels. At the beginning of this year, the Iranian conflict erupted, making the US dollar the market's preferred safe-haven asset. Funds shifted from gold to the US dollar, causing a sharp drop in gold prices. The Middle East conflict caused panic in financial markets, leading to a stock market downturn, which further fueled gold selling. Other traditional safe-haven assets, such as the Japanese yen and the Swiss franc, also performed poorly. In this round of market fluctuations, gold acted more like an insurance policy that had been "earned" by investors. Even with a weakening US Treasury market, the US dollar remained strong; the global bond market was dominated by concerns about stagflation. Compared to most G20 economies, the hawkish shift in US policy rate expectations was limited, yet the US dollar still maintained its strength. Following the attack on Iran, the market lowered its expectations for a Fed rate cut by the end of 2026, with the cut expected to be at least 25 basis points smaller, a change that also weighed on gold. The current market situation shares some similarities with 2022. At the beginning of 2022, gold prices were around $1,800 per ounce, surging to $2,000 per ounce in April, stimulated by the Russia-Ukraine conflict. Subsequently, the strengthening US dollar overshadowed gold's safe-haven appeal, and gold prices entered a period of fluctuation. It wasn't until April 2023 that gold prices stabilized above $2,000 per ounce, but thanks to large-scale gold purchases by central banks and retailers, gold prices began to recover at the end of 2022. In 2025, gold is undoubtedly the best-performing safe-haven asset. In recent months, the stock market and gold have shown a positive correlation; however, this correlation briefly turned negative on Monday, March 2nd: gold surged at the beginning of the Middle East conflict, but on March 3rd, the US dollar dominated market trading, causing a sharp reversal in gold prices. On the first trading day after the attack on Iran, the typically inverse correlation between the US dollar and gold briefly turned positive. This phenomenon occurs in high-risk environments: the US dollar and gold rise simultaneously, indicating that investors are simultaneously vying for two types of safe-haven assets. However, in this round, gold failed to hold onto its gains, succumbing to the strong upward trend of the US dollar. The continued escalation of the conflict, further deterioration of the situation, and continued rise in oil prices could theoretically reignite gold buying; however, based on historical experience with the Ukraine conflict, such buying may not occur for several months. Returning to the relationship between oil and gold: if the conflict is resolved and the Straits are fully reopened, leading to a decline in oil prices, gold can escape the indirect pressure from high oil prices. The core logic is not that oil directly affects gold, but rather that oil first affects the US dollar, real yields, and the stock market, and then these variables are transmitted to gold.
The Link Between Oil and Gold Gold is considered a high-quality safe-haven asset. During periods of escalating geopolitical risk, gold often experiences price increases, allowing investors to diversify their asset allocation and hedge against risk. It is both a commodity and possesses monetary attributes. Due to its safe-haven characteristics, gold is a risk-averse asset, favored by investors when risks intensify. Oil is a core commodity. Oil is a high-risk, pro-cyclical asset with a strong risk appetite, typically rising with economic growth. It also reacts to geopolitical risks, and its price fluctuations spill over into the entire financial market. Oil is a good indicator of global demand, and its price movements often move in tandem with the stock market; higher oil demand often indicates a healthy economy. However, if the price movement is triggered by supply-side shocks—as has been the case for most of this year, with attacks on Iran and the closure of the Strait of Hormuz being examples—rising oil prices will increase inflationary pressures and drag down the stock market. The sharp stock market decline earlier this year was largely due to global market panic triggered by the Iranian conflict, which was exacerbated by soaring oil prices. Most related academic research suggests a significant positive correlation between oil and gold. Specifically, after oil prices fall, gold prices often decline sharply, and vice versa. However, this correlation has weakened. Some academic literature directly states that there is no correlation between the two. However, current academic research does not include the latest price fluctuation data for oil and gold since the outbreak of the recent Iranian conflict. The US dollar is a crucial link between oil and gold. Both assets are priced and traded in US dollars, and historically, they have mostly moved inversely to the dollar. A stronger dollar usually puts downward pressure on gold and oil prices; conversely, a weaker dollar often pushes up gold and oil prices. The relationship between the dollar and gold is particularly complex, influenced by multiple factors: geopolitical situations, inflation expectations, real yields, market investor sentiment, and traditional supply and demand variables such as mineral supply, recycled gold, and jewelry consumption demand. Oil prices are not a reliable predictive indicator . The correlation between gold and oil is complex, dynamic, and asymmetrical. Historically, oil and gold prices have had a strong positive correlation, particularly in the 1970s and 80s, when both assets rose sharply and then fell together. However, this link has clearly weakened. While oil price fluctuations do influence gold prices, the effect is relatively weak. The article "An Analysis of the Volatility and Correlation of Crude Oil and Gold Prices under Socioeconomic Crises" points out that the correlation between Brent crude oil and gold is stronger than that between West Texas Intermediate (WTI) crude oil and gold; the study still concludes that oil prices are poor predictors of gold prices. Looking at a longer timeframe, the correlation between the two fluctuates dramatically. Before and after the outbreak of the Ukraine conflict in 2022, the 3-month rolling correlation coefficient between gold and oil was high. The correlation then weakened, turning negative in late 2023, when gold prices reached $2000/ounce, supported by large-scale gold purchases by central banks. When risk events escalate, central banks continue to buy gold, and oil price volatility narrows, the rolling correlation between the two will periodically turn negative. The 3-month rolling correlation coefficient between Brent crude oil and gold fell from a high of 0.36 on March 1st to -0.5 on July 15th. Despite the escalating US-Iran conflict increasing geopolitical risks and significantly raising oil prices, the correlation coefficient in March plummeted, indicating that the link between the returns of the two asset classes has broken down. Currently, they remain negatively correlated, but the three-month rolling correlation coefficient has converged to -0.11. Shortening the observation period to a one-month high-frequency dimension (see Chart 2 below) reveals that certain trading days significantly alter the overall correlation of returns. Notably, in just two trading days at the beginning of March, the correlation between the two asset classes turned negative. From March 6th (Friday) to March 11th (Tuesday), the one-month rolling correlation coefficient plummeted from a weak positive value of 0.24 to 0.02; the trigger was Monday, March 9th, when Brent crude surged 6.7%, while gold fell 0.6%. Since then, the negative correlation has intensified, reaching a strong negative correlation of -0.72 at the end of May. In the past month, the negative correlation has eased somewhat; both assets rose simultaneously at the end of August, and the correlation coefficient briefly turned positive, but the overall relationship remains negative. Another analytical approach is to calculate how many barrels of crude oil are needed to purchase one ounce of gold. Looking back over the past 50 years, for the vast majority of periods, the purchasing power of one ounce of gold was equivalent to 10-30 barrels of Brent crude oil. As of August 4, 2026, one ounce of gold can be exchanged for approximately 50 barrels of Brent crude oil. This ratio reached 77 barrels in January of this year, approaching a historical extreme; the last time it reached such a high level was in April 2020 during the COVID-19 pandemic, when Brent crude oil prices plummeted, and the ratio peaked at 87 barrels. We believe that the escalating conflict in the Middle East has strengthened the US dollar, putting downward pressure on gold, while the stock market decline has further triggered gold selling. At the same time, the closure of the Strait of Hormuz and the shutdown of oil production capacity in the Gulf region have pushed up oil prices. The oil-gold correlation exhibits drastically different behavior under different crisis environments; recently, oil prices have lost their ability to predict gold prices. Therefore, we do not recommend considering oil prices as a leading indicator of gold prices. A Complex Web of Correlations This year, oil's impact on the US dollar and stock market has exceeded usual levels. At the beginning of this year, the Iranian conflict erupted, making the US dollar the market's preferred safe-haven asset. Funds shifted from gold to the US dollar, causing a sharp drop in gold prices. The Middle East conflict caused panic in financial markets, leading to a stock market downturn, which further fueled gold selling. Other traditional safe-haven assets, such as the Japanese yen and the Swiss franc, also performed poorly. In this round of market fluctuations, gold acted more like an insurance policy that had been "earned" by investors. Even with a weakening US Treasury market, the US dollar remained strong; the global bond market was dominated by concerns about stagflation. Compared to most G20 economies, the hawkish shift in US policy rate expectations was limited, yet the US dollar still maintained its strength. Following the attack on Iran, the market lowered its expectations for a Fed rate cut by the end of 2026, with the cut expected to be at least 25 basis points smaller, a change that also weighed on gold. The current market situation shares some similarities with 2022. At the beginning of 2022, gold prices were around $1,800 per ounce, surging to $2,000 per ounce in April, stimulated by the Russia-Ukraine conflict. Subsequently, the strengthening US dollar overshadowed gold's safe-haven appeal, and gold prices entered a period of fluctuation. It wasn't until April 2023 that gold prices stabilized above $2,000 per ounce, but thanks to large-scale gold purchases by central banks and retailers, gold prices began to recover at the end of 2022. In 2025, gold is undoubtedly the best-performing safe-haven asset. In recent months, the stock market and gold have shown a positive correlation; however, this correlation briefly turned negative on Monday, March 2nd: gold surged at the beginning of the Middle East conflict, but on March 3rd, the US dollar dominated market trading, causing a sharp reversal in gold prices. On the first trading day after the attack on Iran, the typically inverse correlation between the US dollar and gold briefly turned positive. This phenomenon occurs in high-risk environments: the US dollar and gold rise simultaneously, indicating that investors are simultaneously vying for two types of safe-haven assets. However, in this round, gold failed to hold onto its gains, succumbing to the strong upward trend of the US dollar. The continued escalation of the conflict, further deterioration of the situation, and continued rise in oil prices could theoretically reignite gold buying; however, based on historical experience with the Ukraine conflict, such buying may not occur for several months. Returning to the relationship between oil and gold: if the conflict is resolved and the Straits are fully reopened, leading to a decline in oil prices, gold can escape the indirect pressure from high oil prices. The core logic is not that oil directly affects gold, but rather that oil first affects the US dollar, real yields, and the stock market, and then these variables are transmitted to gold.
- Risk Warning and Disclaimer
- The market involves risk, and trading may not be suitable for all investors. This article is for reference only and does not constitute personal investment advice, nor does it take into account certain users’ specific investment objectives, financial situation, or other needs. Any investment decisions made based on this information are at your own risk.

