Oil prices have peaked and reversed course: What does this mean for gold?
2026-10-07 21:26:18
This round of crude oil price movement precisely timed itself within the reversal window of the triangle consolidation apex, completing a bottoming-out and consolidation within the day, completely ending the previous downtrend. This represents the biggest structural turning point in the market this week. For gold, this reversal in oil prices is extremely significant—all recent short-term rebounds and periods of weakness in gold have been primarily supported by expectations of cooling inflation due to the continued decline in oil prices. Now that the oil price decline has completely ended, the short-term bullish logic for gold has been directly disrupted, and downward pressure on precious metals is now highly probable.  First, let's reconstruct the actual market movement on Tuesday, as this is key to understanding the current market situation. On Tuesday morning, WTI crude oil experienced a sharp sell-off, plunging over 2% in a short period, breaking through the lows of late September and reaching a low of $87.40. The market was gripped by panic selling, with bearish sentiment exploding. However, after the rapid decline, the bearish momentum quickly exhausted itself, and the market showed no further downward pressure. Bullish funds capitalized on the situation, resulting in a classic V-shaped reversal. Ultimately, WTI crude oil closed at $89.44, essentially erasing all of its intraday losses. Brent crude oil simultaneously rebounded strongly from below $99, firmly establishing itself above the $100.58 mark, completely breaking free from the short-term downtrend. This turning point in oil prices directly led to significant volatility in precious metals markets. On Tuesday, fueled by the sharp drop in oil prices and cooling market inflation expectations, gold experienced a strong rebound, surging $30.30 in a single day to reach a high of $4187.10. However, this round of price increases was entirely a passive correction driven by weakening oil prices, not the initiation of a bullish trend in gold itself. As oil prices completely reversed and stopped falling, the positive support for gold disappeared, and the market quickly returned to weakness. Gold fell in the morning session, dropping more than $32 to around $4155. Silver's decline during the same period far exceeded that of gold, clearly demonstrating the lack of overall bullish momentum in precious metals. Once the positive factors fade, the market will enter a downward pressure mode. Ignoring the meaningless intraday fluctuations, the current market has only one core trading logic: crude oil precisely completed a false breakout and bottoming at the key apex of the triangle pattern, completely ending the downtrend. This turning point directly eliminated gold's only safety support this week and is the core variable driving the short-term trend of gold going forward. Crude oil's standard false breakout and consolidation has solidified the bottom for this phase. In the previous round, crude oil continued to fall, operating within a converging downward triangle structure. Prices continuously compressed the fluctuation range, ultimately precisely reaching the key reversal point at the apex, forming a textbook-level bottoming pattern. This bottom is not a random fluctuation in funds, but a multi-fold resonance of technical structure, market sentiment, and the switching of bullish and bearish momentum, making it extremely reliable.
 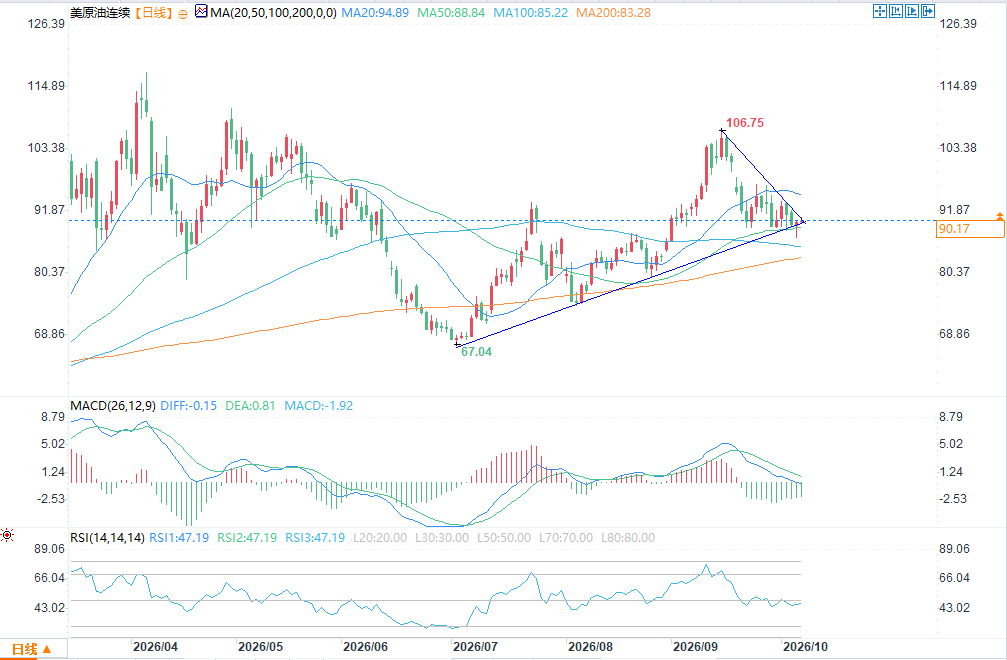 Tuesday's sharp decline was a typical example of a market manipulation tactic by major players to induce short selling and shake out weak hands. The low point formed in late September was a widely recognized short-term support level. This level tends to accumulate a large number of stop-loss orders from retail investors holding long positions, while also attracting a large amount of short-term capital betting on a break below the support level. When the price deliberately breaks through this key support level, it instantly triggers a wave of stop-loss orders and short-selling, creating the illusion of a rapid short-term sell-off and quickly absorbing all floating short positions. Once all the low-level orders have been filled and the last wave of selling pressure has been released, the market loses its downward momentum. At this point, long-term bullish funds that had been waiting at lower levels will enter the market to support prices, causing a rapid rebound and a return to the previously breached support level. Meanwhile, short-term funds that chased the price down are all facing losses, and subsequent stop-loss orders will further fuel the price rebound, completely reversing the intraday bullish/bearish trend. Ultimately, crude oil closed with an exceptionally long lower shadow on the daily chart, closing higher than the opening price, forming a clear bottoming reversal candlestick pattern. The following morning, it continued its slight upward trend, further confirming the bottom. It's worth noting that this triangle apex pattern possesses extremely high uniqueness and accuracy. The previous high in early June perfectly corresponded to this technical apex position, demonstrating the structure's precise guidance on trend reversals in crude oil. From the current market perspective, the probability of a bottom forming in this round of crude oil price movement is extremely high. As long as the price doesn't make new lows and stabilizes above $89, the end of the downtrend and the start of a rebound can be definitively confirmed. There's no need to dwell on minor changes in fundamentals; the market's "bearish news not causing a drop, and a breakout followed by a rebound" is the most reliable trend reversal signal. Many people easily overlook the details of crude oil's fundamentals: the continued recovery of exports from Gulf oil-producing countries and the steady implementation of G7 diesel-related policies create an overall bearish fundamental environment. However, despite the normalization of bearish factors, oil prices have not continued to fall but have instead strongly reversed course. This is a typical example of "bearish news exhausted" and a momentum reversal, a core characteristic of bottom formation. The oil price reversal has solidified the bearish trend, fully confirming the downward pressure on gold.
 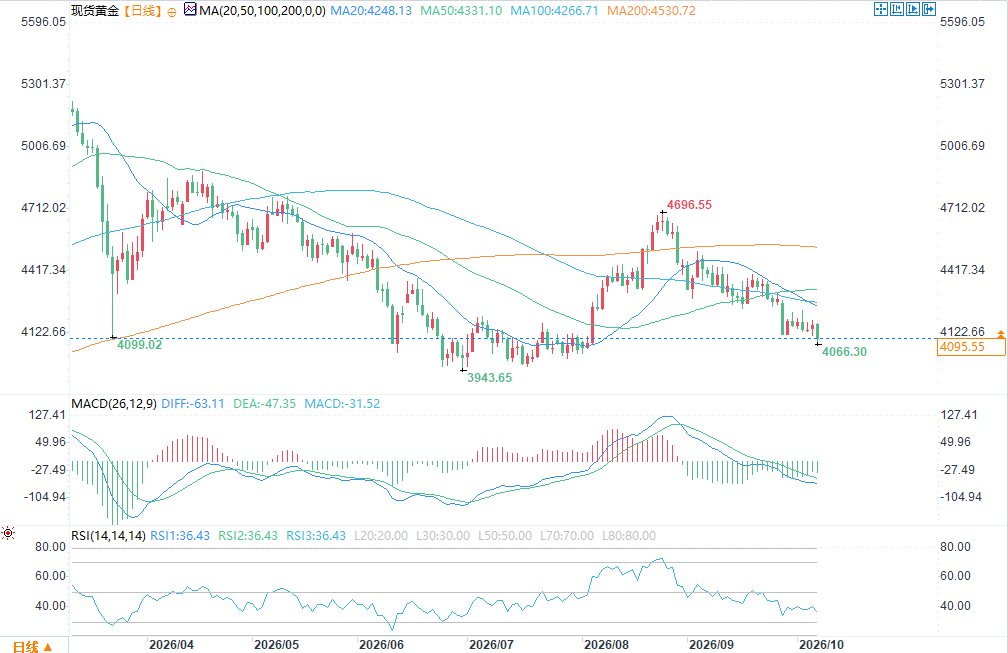 The core pricing logic of gold has always revolved around inflation expectations, and crude oil and diesel are key indicators of global inflation; their fluctuations directly impact the precious metals market. Previously, gold's ability to fluctuate and rebound slightly at high levels was primarily due to the continued decline in oil prices, which eased market concerns about inflation, providing gold with a respite from its weakness. Now that oil prices have completely stopped falling and begun a rebound, the previously declining inflation expectations will quickly rise again. Compared to crude oil prices, diesel prices have a more direct and faster impact on end-user inflation. Diesel prices are already high, and with the rebound in crude oil, diesel prices will further strengthen, continuously pushing up overall market inflationary pressure. This complete transmission chain has re-established its effectiveness: crude oil stops falling and rebounds → diesel prices rise → inflation expectations rise → the bullish factors for precious metals fade, leading to downward pressure. The core logic supporting the previous gold rebound has completely collapsed, and the market's trading focus has returned to a pattern where high inflation suppresses precious metals. Tuesday's surge in gold was merely a short-term sentiment correction brought about by the decline in oil prices and does not signify any trend-based bullish trend. With the oil price inflection point now established, every rebound in gold is merely a technical correction, a bullish trap in a weak market, and not a bullish reversal signal. Current key trading conclusions: 1. Gold's only breathing room this week—the continued decline in oil prices—has completely disappeared, the market's bullish logic has completely broken down, and there is no sustained upward momentum. 2. The double signal of a triangle reversal at the apex of crude oil and a false breakout/washout indicates a solid bottom for this phase, and a continued upward trend is highly likely, putting sustained inflationary pressure on gold. 3. The overall precious metals market is weak, with silver leading the decline and gold's rebound proving weak, fully demonstrating that current market sentiment is bearish, and the sustainability of any corrective rallies is extremely poor. The overall market logic is clear and straightforward: short-term support for gold has completely disappeared, negative factors continue to accumulate, and the main trend going forward is one of oscillating pressure and repeated declines. All rebounds are short-term corrections, and blindly buying the dip to speculate on a bullish trend is not advisable.
First, let's reconstruct the actual market movement on Tuesday, as this is key to understanding the current market situation. On Tuesday morning, WTI crude oil experienced a sharp sell-off, plunging over 2% in a short period, breaking through the lows of late September and reaching a low of $87.40. The market was gripped by panic selling, with bearish sentiment exploding. However, after the rapid decline, the bearish momentum quickly exhausted itself, and the market showed no further downward pressure. Bullish funds capitalized on the situation, resulting in a classic V-shaped reversal. Ultimately, WTI crude oil closed at $89.44, essentially erasing all of its intraday losses. Brent crude oil simultaneously rebounded strongly from below $99, firmly establishing itself above the $100.58 mark, completely breaking free from the short-term downtrend. This turning point in oil prices directly led to significant volatility in precious metals markets. On Tuesday, fueled by the sharp drop in oil prices and cooling market inflation expectations, gold experienced a strong rebound, surging $30.30 in a single day to reach a high of $4187.10. However, this round of price increases was entirely a passive correction driven by weakening oil prices, not the initiation of a bullish trend in gold itself. As oil prices completely reversed and stopped falling, the positive support for gold disappeared, and the market quickly returned to weakness. Gold fell in the morning session, dropping more than $32 to around $4155. Silver's decline during the same period far exceeded that of gold, clearly demonstrating the lack of overall bullish momentum in precious metals. Once the positive factors fade, the market will enter a downward pressure mode. Ignoring the meaningless intraday fluctuations, the current market has only one core trading logic: crude oil precisely completed a false breakout and bottoming at the key apex of the triangle pattern, completely ending the downtrend. This turning point directly eliminated gold's only safety support this week and is the core variable driving the short-term trend of gold going forward. Crude oil's standard false breakout and consolidation has solidified the bottom for this phase. In the previous round, crude oil continued to fall, operating within a converging downward triangle structure. Prices continuously compressed the fluctuation range, ultimately precisely reaching the key reversal point at the apex, forming a textbook-level bottoming pattern. This bottom is not a random fluctuation in funds, but a multi-fold resonance of technical structure, market sentiment, and the switching of bullish and bearish momentum, making it extremely reliable. Tuesday's sharp decline was a typical example of a market manipulation tactic by major players to induce short selling and shake out weak hands. The low point formed in late September was a widely recognized short-term support level. This level tends to accumulate a large number of stop-loss orders from retail investors holding long positions, while also attracting a large amount of short-term capital betting on a break below the support level. When the price deliberately breaks through this key support level, it instantly triggers a wave of stop-loss orders and short-selling, creating the illusion of a rapid short-term sell-off and quickly absorbing all floating short positions. Once all the low-level orders have been filled and the last wave of selling pressure has been released, the market loses its downward momentum. At this point, long-term bullish funds that had been waiting at lower levels will enter the market to support prices, causing a rapid rebound and a return to the previously breached support level. Meanwhile, short-term funds that chased the price down are all facing losses, and subsequent stop-loss orders will further fuel the price rebound, completely reversing the intraday bullish/bearish trend. Ultimately, crude oil closed with an exceptionally long lower shadow on the daily chart, closing higher than the opening price, forming a clear bottoming reversal candlestick pattern. The following morning, it continued its slight upward trend, further confirming the bottom. It's worth noting that this triangle apex pattern possesses extremely high uniqueness and accuracy. The previous high in early June perfectly corresponded to this technical apex position, demonstrating the structure's precise guidance on trend reversals in crude oil. From the current market perspective, the probability of a bottom forming in this round of crude oil price movement is extremely high. As long as the price doesn't make new lows and stabilizes above $89, the end of the downtrend and the start of a rebound can be definitively confirmed. There's no need to dwell on minor changes in fundamentals; the market's "bearish news not causing a drop, and a breakout followed by a rebound" is the most reliable trend reversal signal. Many people easily overlook the details of crude oil's fundamentals: the continued recovery of exports from Gulf oil-producing countries and the steady implementation of G7 diesel-related policies create an overall bearish fundamental environment. However, despite the normalization of bearish factors, oil prices have not continued to fall but have instead strongly reversed course. This is a typical example of "bearish news exhausted" and a momentum reversal, a core characteristic of bottom formation. The oil price reversal has solidified the bearish trend, fully confirming the downward pressure on gold. The core pricing logic of gold has always revolved around inflation expectations, and crude oil and diesel are key indicators of global inflation; their fluctuations directly impact the precious metals market. Previously, gold's ability to fluctuate and rebound slightly at high levels was primarily due to the continued decline in oil prices, which eased market concerns about inflation, providing gold with a respite from its weakness. Now that oil prices have completely stopped falling and begun a rebound, the previously declining inflation expectations will quickly rise again. Compared to crude oil prices, diesel prices have a more direct and faster impact on end-user inflation. Diesel prices are already high, and with the rebound in crude oil, diesel prices will further strengthen, continuously pushing up overall market inflationary pressure. This complete transmission chain has re-established its effectiveness: crude oil stops falling and rebounds → diesel prices rise → inflation expectations rise → the bullish factors for precious metals fade, leading to downward pressure. The core logic supporting the previous gold rebound has completely collapsed, and the market's trading focus has returned to a pattern where high inflation suppresses precious metals. Tuesday's surge in gold was merely a short-term sentiment correction brought about by the decline in oil prices and does not signify any trend-based bullish trend. With the oil price inflection point now established, every rebound in gold is merely a technical correction, a bullish trap in a weak market, and not a bullish reversal signal. Current key trading conclusions: 1. Gold's only breathing room this week—the continued decline in oil prices—has completely disappeared, the market's bullish logic has completely broken down, and there is no sustained upward momentum. 2. The double signal of a triangle reversal at the apex of crude oil and a false breakout/washout indicates a solid bottom for this phase, and a continued upward trend is highly likely, putting sustained inflationary pressure on gold. 3. The overall precious metals market is weak, with silver leading the decline and gold's rebound proving weak, fully demonstrating that current market sentiment is bearish, and the sustainability of any corrective rallies is extremely poor. The overall market logic is clear and straightforward: short-term support for gold has completely disappeared, negative factors continue to accumulate, and the main trend going forward is one of oscillating pressure and repeated declines. All rebounds are short-term corrections, and blindly buying the dip to speculate on a bullish trend is not advisable.
- Risk Warning and Disclaimer
- The market involves risk, and trading may not be suitable for all investors. This article is for reference only and does not constitute personal investment advice, nor does it take into account certain users’ specific investment objectives, financial situation, or other needs. Any investment decisions made based on this information are at your own risk.