Are the preliminary non-farm payroll figures reliable? The US dollar index faces a more critical statistical issue than 29,000.
2026-10-07 22:00:19
On Wednesday, October 7th, the US dollar index rebounded after falling in the previous trading day, currently trading around 102.4, with a daily increase of approximately 0.5%; the 10-year US Treasury yield once approached 5.35%. The core issue currently facing the market is not simply the strength of the employment situation, but rather the declining reliability of initial employment data, the repricing of bond yields, and the time lag in Federal Reserve policy information. In particular, the fact that US non-farm payrolls increased by only 29,000 in September, while the data for the previous two months were revised downwards again, makes the question of "how much of the first published data truly reflects the trend" a crucial variable in the pricing of the US dollar index. 
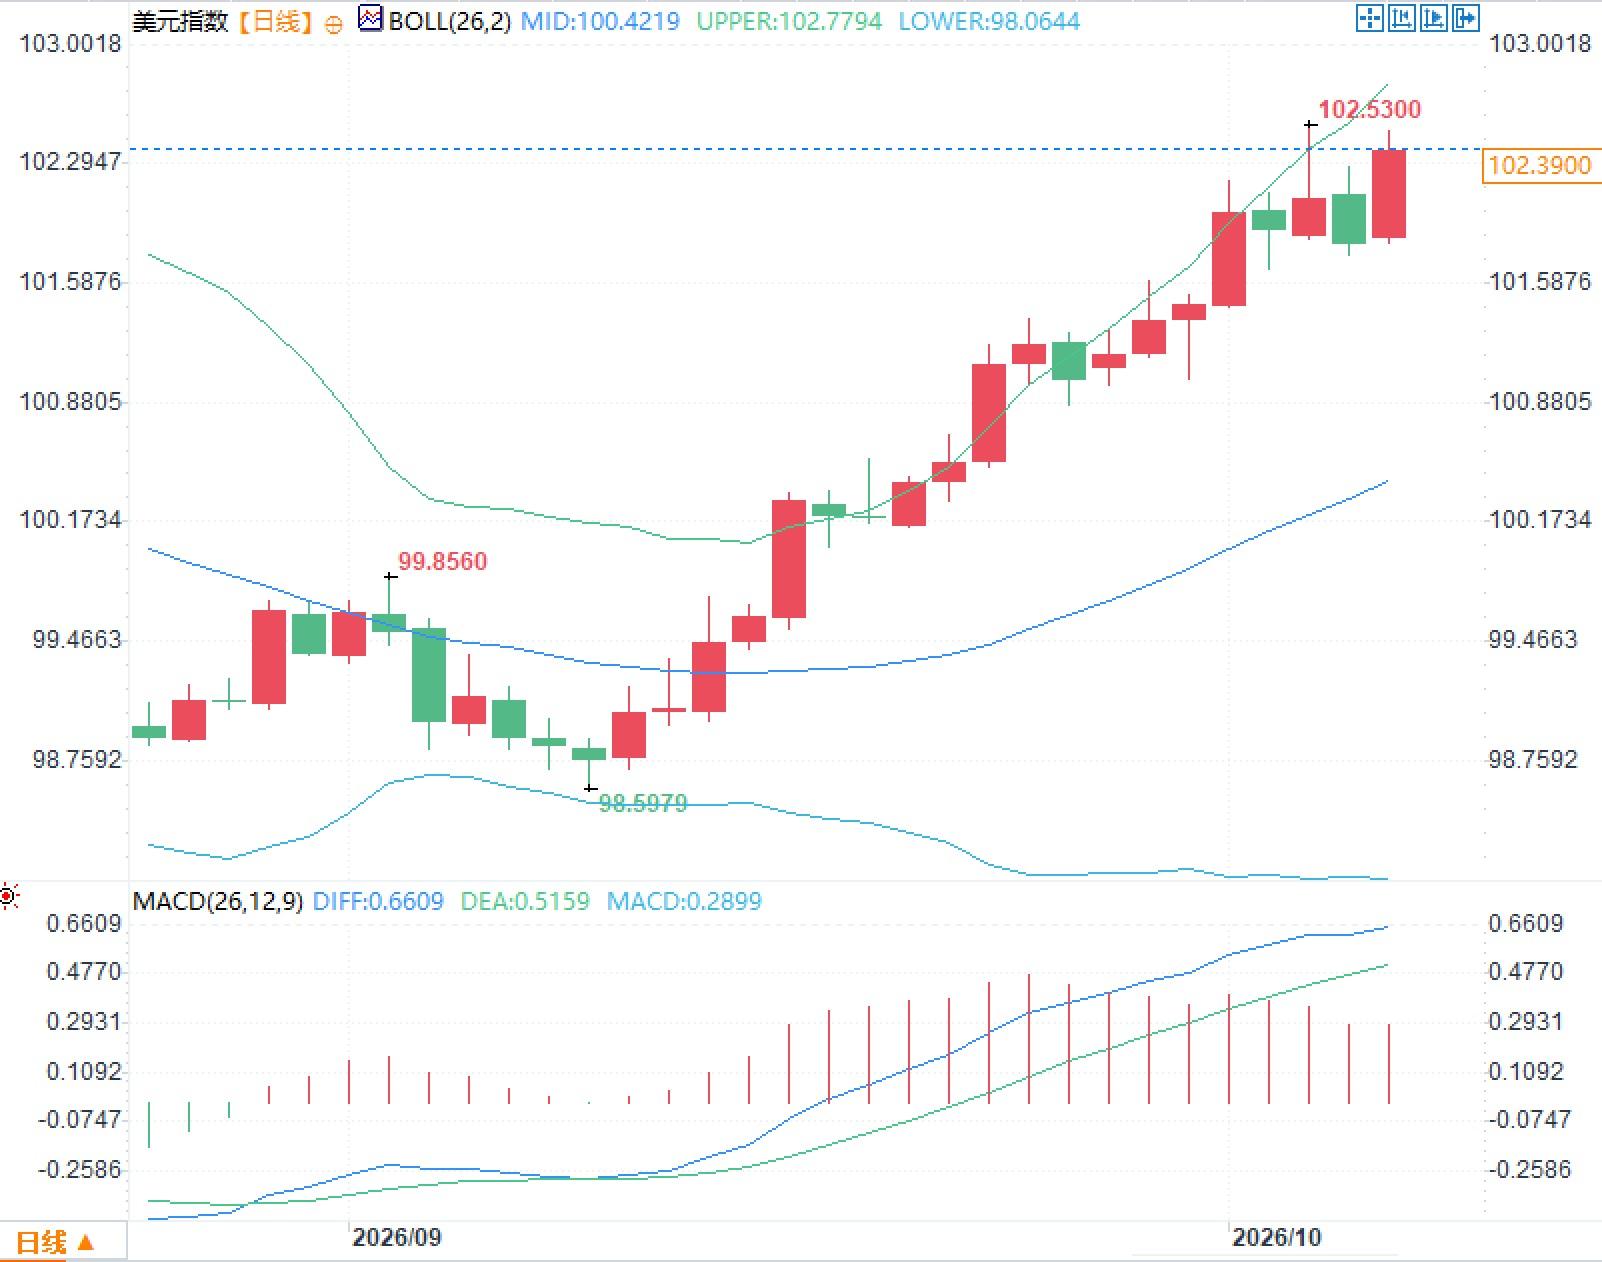 Observing the daily chart of the US Dollar Index, the price is above the middle Bollinger Band and close to the upper band, and the Bollinger Bands are widening again; the MACD's DIF is higher than the DEA, and both indicator lines are above the zero axis, but the rate of expansion of the histogram has shown marginal changes. This structure indicates that price trends, volatility, and momentum are still at a high level, but the different indicators are not completely synchronized.
US non-farm payrolls were weak in September, but data revisions are more noteworthy than the single-month figures.
The latest official employment report shows that non-farm payrolls increased by only 29,000 in September, significantly lower than the average monthly increase of 45,000 over the past 12 months; the unemployment rate remained at 4.2%, and the labor force participation rate was 61.8%. Average hourly earnings increased by 0.1% month-on-month and 3.0% year-on-year, with the average weekly working hours remaining at 34.4 hours. Looking at these indicators alone, the momentum for new job creation in the job market is already at a relatively low level. However, what truly affects the interpretation of the data is the revision. July's non-farm payrolls were revised down from +21,000 to -10,000, and August's were revised down from +162,000 to +133,000, a combined decrease of 60,000 over the two months. Calculated according to the latest revised data, the average monthly increase in employment from July to September was approximately 51,000, not significantly different from the average level of the past 12 months. This indicates that while the single-month increase of 29,000 is noticeable, when considered within the context of continuous data, its macroeconomic implications cannot be simply equated with a sudden change in employment trends. Furthermore, the preliminary annual baseline for employment levels in March 2026 has been revised to -79,000, with the private sector at -178,000. The scale of the revision itself further illustrates that the initial nonfarm payrolls figure is a high-frequency estimate, rather than the final statistical fact.Why is it particularly important to distinguish between "market shock" and "statistical reliability" in September's non-farm payrolls data?
A recent study on the discrepancy between preliminary and final non-farm payroll data found that, measured by mean absolute error, April's preliminary non-farm payroll data historically had the highest reliability, with November also relatively high; January, September, March, and May typically saw larger revisions. The mean absolute error for the least reliable month was nearly twice that of the most reliable month. While using a three-month moving average can reduce some monthly noise, it cannot eliminate revision issues. The three-month averages for April, July, and October were relatively stable, while January, May, and September remained months with higher errors. This conclusion is particularly important in the current environment because the latest data released is for September. In other words, the preliminary figure of 29,000 still has an informational impact on short-term asset repricing, but the statistical interpretation of the final employment trend needs to allow for revision. This error is not an anomaly. Monthly non-farm payrolls are revised as businesses replenish returns and seasonal adjustments are made, and the annual benchmark further calibrates employment levels using broader data coverage. Therefore, the first layer of information is how much policy expectations are changed immediately after the data release; the second layer is how much macroeconomic meaning the data retains after subsequent revisions. Confusing the two layers of information can easily lead to an overestimation of the importance of monthly data.The technical structure of the US dollar index is reflecting the coexistence of "high yields and weak employment".
In September, the Federal Reserve raised the target range for the federal funds rate by 25 basis points to 3.75% to 4.00%. At the time, the policy statement indicated that job growth was broadly keeping pace with changes in labor supply, while emphasizing that inflation remained high. Subsequent releases of September employment data and downward revisions to July and August figures provided the market with further information. Therefore, the September meeting minutes released on October 7th are essentially an earlier data snapshot and cannot fully represent the current employment information set. Observing the daily chart of the US Dollar Index, the price is above the middle Bollinger Band and close to the upper band, and the Bollinger Bands are widening again; the MACD's DIF is higher than the DEA, and both indicator lines are above the zero axis, but the rate of expansion of the histogram has shown marginal changes. This structure indicates that price trends, volatility, and momentum are still at a high level, but the different indicators are not completely synchronized.Frequently Asked Questions
Question 1: Why can't we directly conclude that the employment trend has deteriorated significantly because September's non-farm payrolls only increased by 29,000? Answer: Because, based on the latest revised data, the average monthly increase in employment from July to September is approximately 51,000, and September historically has a relatively large initial revision error. While single-month data can create market shocks, the final macroeconomic judgment needs to consider subsequent revisions, unemployment rates, working hours, and wages. Question 2: Can the three-month moving average solve the problem of distorted non-farm payroll data? Answer: It can only reduce some monthly random errors; it cannot eliminate the biases caused by baseline revisions and seasonal adjustments. Research shows that even using the three-month average, the historical error for January, May, and September remains relatively high.- Risk Warning and Disclaimer
- The market involves risk, and trading may not be suitable for all investors. This article is for reference only and does not constitute personal investment advice, nor does it take into account certain users’ specific investment objectives, financial situation, or other needs. Any investment decisions made based on this information are at your own risk.