The US dollar index and the pace of the Federal Reserve's interest rate hikes have undergone subtle changes: What are the differences between the October and December meetings?
2026-10-08 18:26:16
On Thursday, October 8th, the US dollar index was trading above 102.30, near its highest level in 18 months. Meanwhile, the minutes of the Federal Reserve's September meeting signaled continued focus on inflation, with Governor Christopher Waller further elaborating on the stance on interest rate hikes. The market pricing of the US dollar index is being influenced by policy rate expectations, energy costs, international bond yields, and volatility in European currencies. The core issue in the current market has shifted from simply discussing the necessity of interest rate hikes to a reassessment of the pace of policy and its transmission mechanism. 
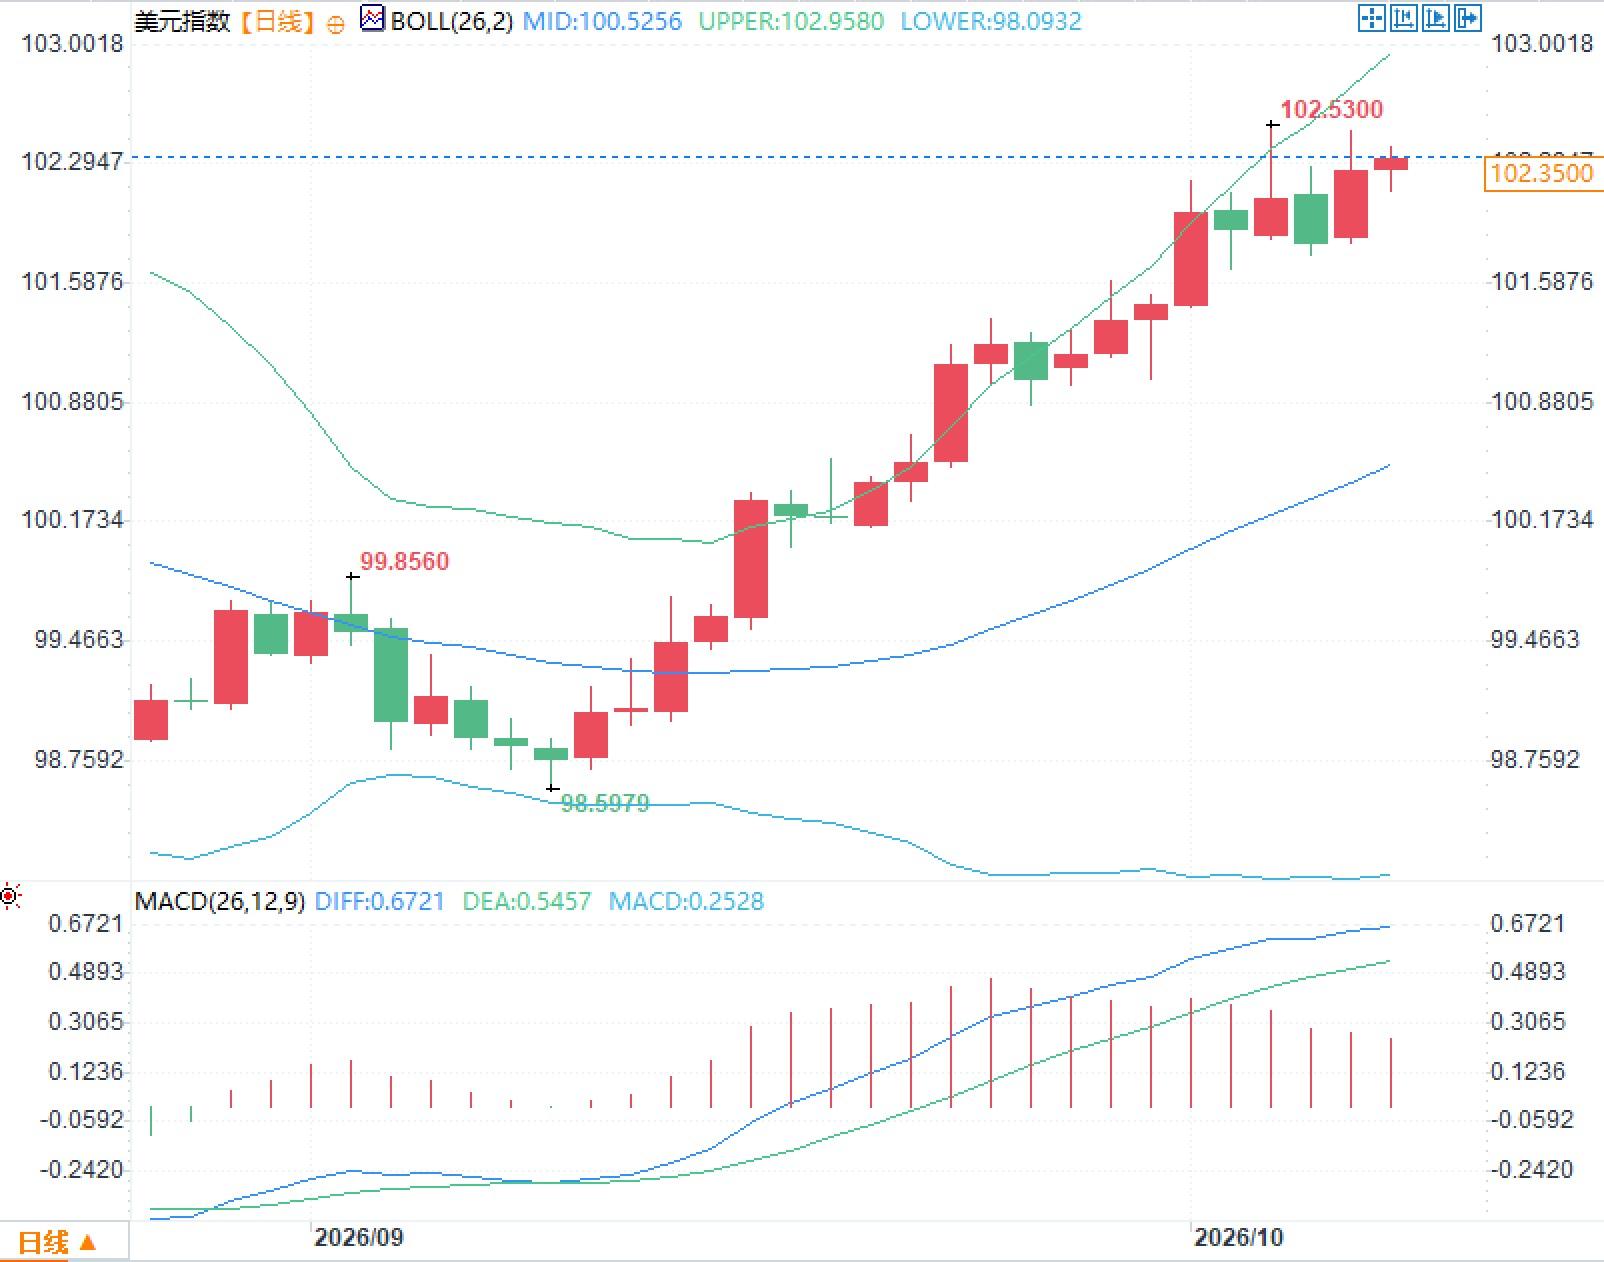 MACD data shows that the DIFF is 0.6721, the DEA is 0.5457, and the histogram is 0.2528. Both smoothing lines remain positive, but the recent histogram height has narrowed compared to before. Mathematically, this indicates that the gap between short-term momentum and the smoothing signal line has narrowed, but it does not necessarily mean that the current price structure has reversed.
I. Waller releases key policy signal: Continued interest rate hikes do not equate to continuous interest rate hikes.
On October 8, Waller stated that if subsequent economic data meets expectations, further interest rate hikes would still be necessary to push inflation back to the 2% target in a timely manner. However, rate hikes do not need to be implemented in consecutive policy meetings, allowing for some flexibility in the specific timing. The importance of this statement lies in clearly distinguishing between the degree of monetary policy tightening and the pace of implementation. In September, the Federal Reserve unanimously decided to raise interest rates by 25 basis points, increasing the target range for the federal funds rate to 3.75%-4.00%, the first rate hike since July 2023. The meeting minutes released on October 7 showed that most officials believed that further interest rate hikes this year might be appropriate, but future decisions would still depend on economic data. The median interest rate in the September economic forecasts for the end of 2026 was approximately 4.1%, and the same for the end of 2027. Notably, 8 out of 18 forecasters believed that the interest rate at the end of 2027 should be 50 basis points higher than the median rate after the September rate hike. Currently, market expectations for another interest rate hike at the October 27-28 meeting have cooled somewhat, while attention has increased accordingly towards policy adjustments in December. However, the change in the probability of the meeting does not equate to a reversal of the overall tightening stance.II. Sticky Inflation and Slowing Employment: What Policy Constraints Does the Federal Reserve Face?
Waller emphasized that the September rate hike was not driven by a single economic indicator, but rather a comprehensive response to persistent inflationary pressures. The Fed's September economic projections show that by the end of 2026, the overall personal consumption expenditures price index inflation is expected to be 3.7%, and the core index is expected to be 3.4%, both significantly higher than the long-term target of 2%. It's important to distinguish that these are year-end projections, not the actual inflation data already released in October. Energy prices are a crucial variable in the current inflation transmission mechanism. The continuously rising energy costs not only directly affect consumer prices but may also spread to other sectors through transportation, production inputs, and corporate pricing mechanisms. Meanwhile, investment in artificial intelligence infrastructure has increased demand for equipment, electricity, and financing, potentially leading to a situation where demand expansion outpaces supply adjustment in some industries. Therefore, monetary policy focuses not only on short-term price changes but also on whether cost shocks evolve into widespread and sustained inflation, and whether long-term public inflation expectations remain stable. The labor market provides another set of data that requires comprehensive assessment. The September non-farm payrolls, released on October 2nd, showed an increase of 29,000 jobs, with an unemployment rate of 4.2%. The relatively limited increase in new jobs indicates that marginal changes in labor demand warrant attention, but this should not be used to directly conclude that overall economic activity has contracted significantly. This means the Federal Reserve needs to simultaneously weigh the persistence of inflation, job growth, and financial conditions. The September consumer price data, scheduled for release on October 14, will provide new evidence regarding price pressures.III. The True Pricing Logic of the US Dollar Index: What Forces Exceed Interest Rate Differentials?
The recent changes in the US dollar index cannot be entirely attributed to expectations of a Federal Reserve interest rate hike. From a compositional perspective, the US dollar index uses a weighted geometric average of six major currencies, with the euro accounting for 57.6%, the yen for 13.6%, and the pound for 11.9%. This means that fluctuations in European exchange rates have a significant impact on the index. Recent changes in fiscal risk premiums in some European sovereign bond markets have continued to affect the euro's performance. At the same time, rising energy costs and changes in international bond yields have led to both interest rate differential adjustments and risk repricing in the currency market. From an interest rate analysis perspective, rising nominal bond yields need to be further broken down into real yields, inflation compensation, and term premiums. The impact mechanisms of yield changes driven by different factors on the exchange rate market are not the same. For example, changes in real yields mainly relate to the relative returns of asset holdings, while increased inflation compensation may reflect increased uncertainty about future purchasing power. Term premiums involve factors such as fiscal financing, bond supply, and risk tolerance. Therefore, the performance of the US dollar index is essentially a comprehensive result of changes in the relative prices of multiple currencies, rather than a mechanical mapping of a single interest rate decision.IV. Technical Specifications Breakdown
Observing the daily chart of the US dollar index, the index is located above the middle band and below the upper band of the Bollinger Bands, with the middle band gradually rising and the channel width widening compared to before. This structure reflects a change in the price mean and volatility dispersion in the rolling sample. MACD data shows that the DIFF is 0.6721, the DEA is 0.5457, and the histogram is 0.2528. Both smoothing lines remain positive, but the recent histogram height has narrowed compared to before. Mathematically, this indicates that the gap between short-term momentum and the smoothing signal line has narrowed, but it does not necessarily mean that the current price structure has reversed.
- Risk Warning and Disclaimer
- The market involves risk, and trading may not be suitable for all investors. This article is for reference only and does not constitute personal investment advice, nor does it take into account certain users’ specific investment objectives, financial situation, or other needs. Any investment decisions made based on this information are at your own risk.