Gold Price Forecast: Gold prices rebounded as US interest rates and oil prices fell.
2026-10-13 18:12:18
On Tuesday (October 13), spot gold recovered Monday's losses during the European session, thanks to a weaker dollar—US Treasury yields fell from their highs—and a slight pullback in oil prices. Investors are awaiting US inflation data later this week for a more accurate assessment of the Federal Reserve's near-term policy direction. Spot gold was trading at $4,183.51, up 0.28%. The price remains below the upper limit of its two-week trading range, at $4,230.  The dollar index, which measures the dollar's value against six major currencies, fell 0.21% on Tuesday. This decline was driven by a slight drop in U.S. Treasury yields and a moderate pullback in oil prices. Correlation studies suggest that precious metal prices would rise in such circumstances; however, the weak market sentiment suggests the dollar's decline is likely to remain limited. Cleveland Federal Reserve Chair Beth Hammark reiterated her call for higher interest rates to control inflation. In her view, inflation has become more prevalent and is beginning to influence corporate pricing strategies. Geopolitically, Saudi Arabia stated it faces a new wave of attacks, and Riyadh airport will remain temporarily closed following Saturday's deadly missile attack by the Houthi rebels in Yemen, allied with Iran. Investors may reduce their long dollar positions ahead of Wednesday's U.S. Consumer Price Index and Thursday's Producer Price Index. According to the FedWatch tool, the latest data indicates a very low probability of a Fed rate hike in October, at only 20%; however, the possibility of a December rate hike remains. The market will analyze this week's data to confirm this. Technical Analysis
 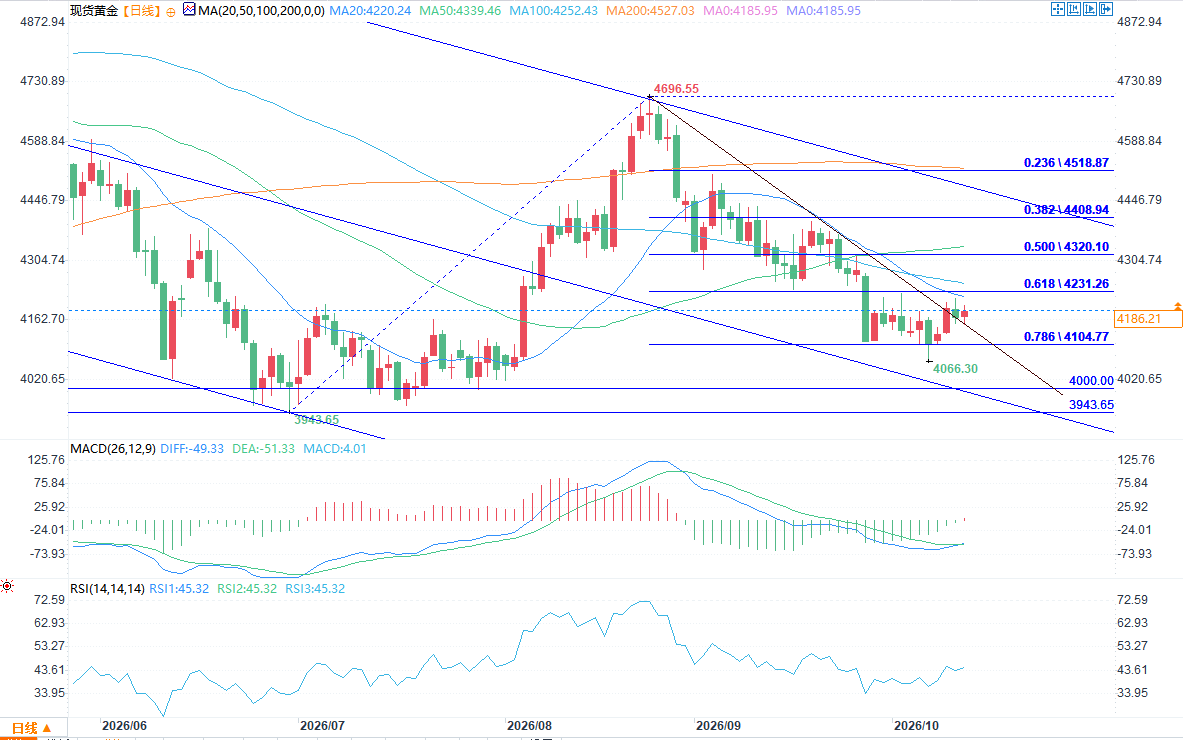 (Spot gold daily chart source: FX678) Since the high of 4696.55 at the end of August, gold prices have found support at a low of 4066.30, with the downward momentum clearly weakening. Prices have broken upwards through the downtrend line, interrupting the main short-term decline. The price is currently consolidating within a rectangular range between the 0.786 (4104.77) and 0.618 (4231.26) Fibonacci retracement levels, with strong buying support around 4100, which has become a key short-term support level. In terms of moving averages, the current price is trading below the MA20, MA50, MA100, and MA200, with these moving averages forming layers of resistance. From a mean reversion perspective, the long-term deviation of gold prices from the medium- and long-term moving averages suggests a need for correction, presenting a potential for a short-term rebound. However, this does not equate to a trend reversal; the primary target of the rebound is to test the resistance of the moving averages above. In terms of indicators, the MACD has formed a golden cross below the zero line, but the red bars are small, indicating only a weakening of bearish momentum. The overall trend remains bearish, and the upward rebound is weak. The RSI is currently at 45.25, having moved out of the previous oversold zone but not yet firmly established above the 50 level, indicating a balanced tug-of-war between bulls and bears. From a fundamental perspective, the current hawkish interest rate environment continues to suppress gold valuations, and the medium-to-long-term downward trend remains unchanged. This current movement is primarily defined as a corrective rebound within a downtrend. From a short-term trading perspective: the market is expected to remain within the 4104-4231 range. A break above 4231 with significant volume would open up further upside potential; however, a decisive break below 4104 on the daily chart would end this corrective move, with bears regaining control.
The dollar index, which measures the dollar's value against six major currencies, fell 0.21% on Tuesday. This decline was driven by a slight drop in U.S. Treasury yields and a moderate pullback in oil prices. Correlation studies suggest that precious metal prices would rise in such circumstances; however, the weak market sentiment suggests the dollar's decline is likely to remain limited. Cleveland Federal Reserve Chair Beth Hammark reiterated her call for higher interest rates to control inflation. In her view, inflation has become more prevalent and is beginning to influence corporate pricing strategies. Geopolitically, Saudi Arabia stated it faces a new wave of attacks, and Riyadh airport will remain temporarily closed following Saturday's deadly missile attack by the Houthi rebels in Yemen, allied with Iran. Investors may reduce their long dollar positions ahead of Wednesday's U.S. Consumer Price Index and Thursday's Producer Price Index. According to the FedWatch tool, the latest data indicates a very low probability of a Fed rate hike in October, at only 20%; however, the possibility of a December rate hike remains. The market will analyze this week's data to confirm this. Technical Analysis (Spot gold daily chart source: FX678) Since the high of 4696.55 at the end of August, gold prices have found support at a low of 4066.30, with the downward momentum clearly weakening. Prices have broken upwards through the downtrend line, interrupting the main short-term decline. The price is currently consolidating within a rectangular range between the 0.786 (4104.77) and 0.618 (4231.26) Fibonacci retracement levels, with strong buying support around 4100, which has become a key short-term support level. In terms of moving averages, the current price is trading below the MA20, MA50, MA100, and MA200, with these moving averages forming layers of resistance. From a mean reversion perspective, the long-term deviation of gold prices from the medium- and long-term moving averages suggests a need for correction, presenting a potential for a short-term rebound. However, this does not equate to a trend reversal; the primary target of the rebound is to test the resistance of the moving averages above. In terms of indicators, the MACD has formed a golden cross below the zero line, but the red bars are small, indicating only a weakening of bearish momentum. The overall trend remains bearish, and the upward rebound is weak. The RSI is currently at 45.25, having moved out of the previous oversold zone but not yet firmly established above the 50 level, indicating a balanced tug-of-war between bulls and bears. From a fundamental perspective, the current hawkish interest rate environment continues to suppress gold valuations, and the medium-to-long-term downward trend remains unchanged. This current movement is primarily defined as a corrective rebound within a downtrend. From a short-term trading perspective: the market is expected to remain within the 4104-4231 range. A break above 4231 with significant volume would open up further upside potential; however, a decisive break below 4104 on the daily chart would end this corrective move, with bears regaining control.
- Risk Warning and Disclaimer
- The market involves risk, and trading may not be suitable for all investors. This article is for reference only and does not constitute personal investment advice, nor does it take into account certain users’ specific investment objectives, financial situation, or other needs. Any investment decisions made based on this information are at your own risk.