How will the market perform for the remainder of 2026?
2026-10-14 01:56:18
Last weekend, I discussed the outlook for gold and the trading logic behind currency devaluation. I am bullish on gold and other precious metals because fiscal policies in most developed economies have embarked on an unsustainable path. Readers are more concerned with what factors could trigger a significant correction in gold prices, and what the core drivers of the market will be for the remainder of 2026. This article will outline these variables and analyze the market's potential performance under different scenarios.  I believe that two core risk factors will dominate the market for the remainder of 2026. The first is oil prices – are we about to witness another sharp rise in oil prices? The second is the situation in France, which seems to be escalating on its own and could potentially develop into a separate, unique risk. Of course, other risks exist. One is the Federal Reserve under Warsh's leadership, whose policy stance has unexpectedly shifted from dovish to hawkish. Other risks include the midterm elections and the AI bubble; a burst bubble would have a huge impact on the market. However, regarding the timeframe we are discussing – the last three months before the end of the year – I subjectively believe that oil prices and the situation in France are the most crucial variables to watch. The scenario matrix above shows my judgments on the trends of the US dollar, euro, 10-year US Treasury yield, gold, and the S&P 500 (SPX) under different scenarios. The vertical axis of the matrix distinguishes between two scenarios: oil prices continuing to rise (top row) and oil prices falling (bottom row); the horizontal axis divides into two scenarios: the left side represents a full-blown crisis in France, and the right side represents France barely maintaining the status quo (which is the best outcome the market can expect). The blue percentages represent my subjective probabilities for each of these four scenarios. In my view, current oil prices are too high: the supply situation is far better than in March and April, yet oil prices have returned to levels seen in March and April of that year. Therefore, I estimate a 70% probability of oil prices falling further, and only a 30% probability of them continuing to rise. I believe there is a 30% probability of a full-blown crisis in France, and a 70% probability of barely maintaining the status quo. The two most volatile market scenarios appear in the upper left and lower right quadrants of the matrix.
 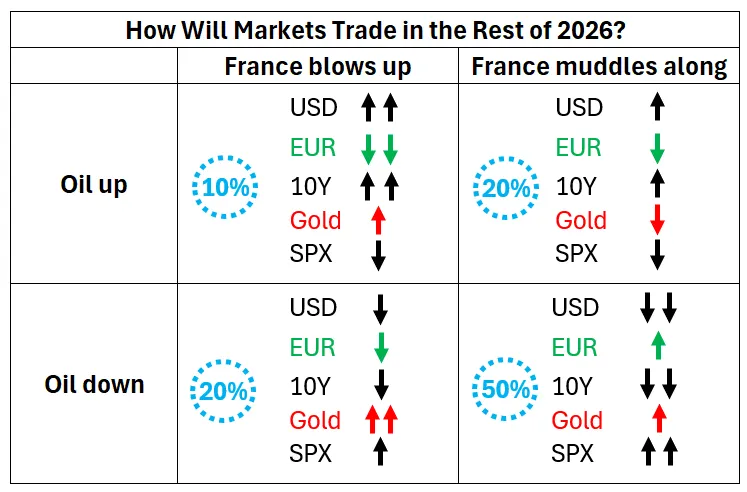 Top left quadrant: Soaring oil prices coupled with a full-blown French crisis. The US dollar will strengthen significantly; simultaneously, European funds will flow into safe-haven assets, driving up gold prices. The completely opposite scenario is a decline in oil prices and France barely stabilizing the situation (bottom right quadrant). The market will digest the Fed's interest rate hike expectations, the US dollar will weaken significantly, and the S&P 500 will be the biggest beneficiary. For gold, the bottom left quadrant is the most noteworthy: falling oil prices, but a continued French crisis. On the one hand, lower oil prices are beneficial to gold; on the other hand, turmoil in the Eurozone will generate safe-haven buying, a double factor boosting gold prices. In my view, only the top right quadrant scenario will cause gold to fall, and even then, the downside for gold will not be significant. Specifically for gold, my core conclusion is: the probability of gold falling is only 20% (corresponding to the top right quadrant), and even if this scenario is triggered, the price drop will be limited. Therefore, the overall profit and loss structure is asymmetrical, with the upside potential greater than the downside potential. In the scenario with the highest probability (lower right quadrant), the S&P 500 has considerable upside potential, while the US dollar and the 10-year US Treasury yield are likely to decline.
I believe that two core risk factors will dominate the market for the remainder of 2026. The first is oil prices – are we about to witness another sharp rise in oil prices? The second is the situation in France, which seems to be escalating on its own and could potentially develop into a separate, unique risk. Of course, other risks exist. One is the Federal Reserve under Warsh's leadership, whose policy stance has unexpectedly shifted from dovish to hawkish. Other risks include the midterm elections and the AI bubble; a burst bubble would have a huge impact on the market. However, regarding the timeframe we are discussing – the last three months before the end of the year – I subjectively believe that oil prices and the situation in France are the most crucial variables to watch. The scenario matrix above shows my judgments on the trends of the US dollar, euro, 10-year US Treasury yield, gold, and the S&P 500 (SPX) under different scenarios. The vertical axis of the matrix distinguishes between two scenarios: oil prices continuing to rise (top row) and oil prices falling (bottom row); the horizontal axis divides into two scenarios: the left side represents a full-blown crisis in France, and the right side represents France barely maintaining the status quo (which is the best outcome the market can expect). The blue percentages represent my subjective probabilities for each of these four scenarios. In my view, current oil prices are too high: the supply situation is far better than in March and April, yet oil prices have returned to levels seen in March and April of that year. Therefore, I estimate a 70% probability of oil prices falling further, and only a 30% probability of them continuing to rise. I believe there is a 30% probability of a full-blown crisis in France, and a 70% probability of barely maintaining the status quo. The two most volatile market scenarios appear in the upper left and lower right quadrants of the matrix. Top left quadrant: Soaring oil prices coupled with a full-blown French crisis. The US dollar will strengthen significantly; simultaneously, European funds will flow into safe-haven assets, driving up gold prices. The completely opposite scenario is a decline in oil prices and France barely stabilizing the situation (bottom right quadrant). The market will digest the Fed's interest rate hike expectations, the US dollar will weaken significantly, and the S&P 500 will be the biggest beneficiary. For gold, the bottom left quadrant is the most noteworthy: falling oil prices, but a continued French crisis. On the one hand, lower oil prices are beneficial to gold; on the other hand, turmoil in the Eurozone will generate safe-haven buying, a double factor boosting gold prices. In my view, only the top right quadrant scenario will cause gold to fall, and even then, the downside for gold will not be significant. Specifically for gold, my core conclusion is: the probability of gold falling is only 20% (corresponding to the top right quadrant), and even if this scenario is triggered, the price drop will be limited. Therefore, the overall profit and loss structure is asymmetrical, with the upside potential greater than the downside potential. In the scenario with the highest probability (lower right quadrant), the S&P 500 has considerable upside potential, while the US dollar and the 10-year US Treasury yield are likely to decline.
- Risk Warning and Disclaimer
- The market involves risk, and trading may not be suitable for all investors. This article is for reference only and does not constitute personal investment advice, nor does it take into account certain users’ specific investment objectives, financial situation, or other needs. Any investment decisions made based on this information are at your own risk.