Stronger-than-expected US CPI data triggered a new round of selling, pushing gold prices below $4,100.
2026-10-15 02:08:20
On Wednesday (October 14), during the US trading session, the US dollar rose, boosted by stronger-than-expected US inflation data, causing spot gold to extend its intraday losses further. It traded around $4083, down 1.86% on the day. The US September Consumer Price Index (CPI) rose 0.6% month-on-month, in line with market expectations and up from August's 0.4% increase; the year-on-year CPI increase climbed to 3.7% from 3.4%, higher than the market expectation of 3.6%.  The core CPI, excluding food and energy, rose 0.3% month-on-month, higher than the market expectation of 0.2% and in line with the August growth rate; the core CPI rose 2.6% year-on-year from 2.4%, also exceeding the expected value of 2.5%. The US dollar index (DXY) climbed to around 102.70, a new high since April 2025. Previously, US Treasury yields had weakened, but rebounded sharply after the CPI release, with the 10-year Treasury yield rising about 10 basis points before falling back to 5.209%. A stronger dollar will increase the cost for overseas buyers to purchase gold; while higher yields will increase the opportunity cost of holding gold—gold itself does not generate interest income. Tensions in the Middle East are pushing up energy prices, remaining a significant driver of inflation. Oil supply continues to face potential risks, and high fuel costs may keep inflation above the Fed's 2% target for a longer period. Against this backdrop, the market expects the Fed to maintain its tight monetary policy stance. The money market is betting that the Fed will raise interest rates three more times by the end of 2027. According to the CME FedWatch Tool, traders are currently pricing in a 37% probability of a rate hike at the Fed's October 27-28 meeting, compared to only 22% before the CPI data release; the probability of a December rate hike is close to 95%. New York Fed President John Williams stated on Tuesday that 2026 "might be appropriate for another rate hike." However, he currently believes that further rate hikes are unnecessary in 2027 and expects inflation to fall back towards the 2% target next year. Technical analysis: Spot gold is maintaining a range-bound trading pattern below key daily moving averages.
 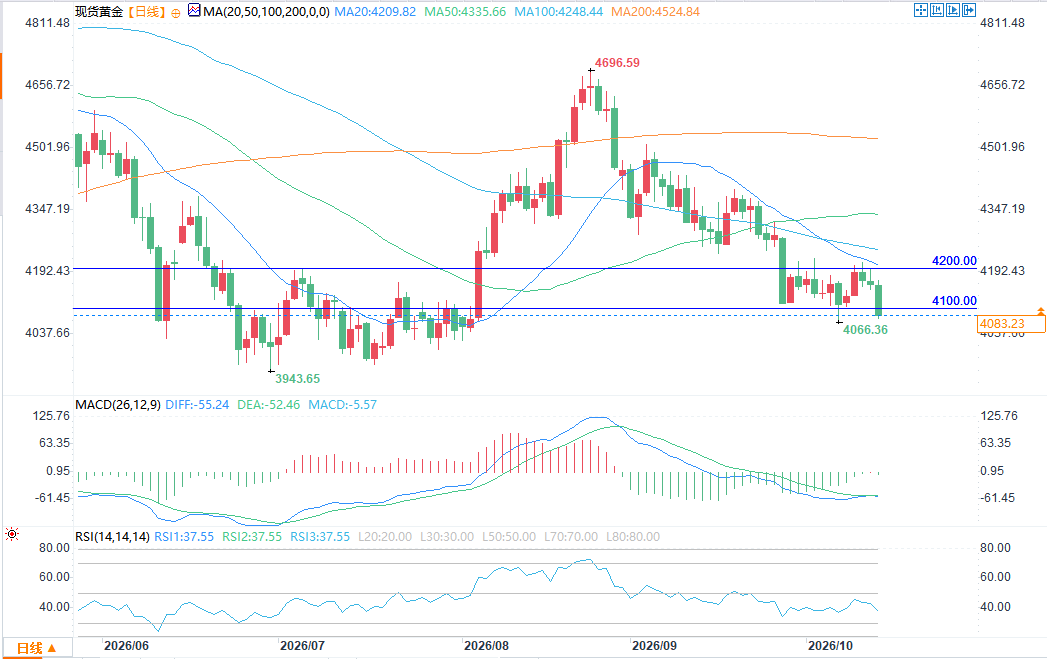 On the daily chart, spot gold continues its downward trend, having broken below the 50-day, 100-day, and 200-day simple moving averages. Market momentum is weak, with the Relative Strength Index (RSI) hovering around 38 and the MACD indicator showing a slight negative value. This indicates that although gold prices have been trading within a range recently, bears still hold a slight advantage. Initial resistance is at the psychological level of $4200, followed by the 100-day moving average at $4249 and the 50-day moving average at $4336. A stronger rebound would face resistance at the $4400 level, followed by the 200-day moving average at $4525. On the downside, a decisive break below $4100 would open up downside potential towards the $4000-$3950 support zone.
The core CPI, excluding food and energy, rose 0.3% month-on-month, higher than the market expectation of 0.2% and in line with the August growth rate; the core CPI rose 2.6% year-on-year from 2.4%, also exceeding the expected value of 2.5%. The US dollar index (DXY) climbed to around 102.70, a new high since April 2025. Previously, US Treasury yields had weakened, but rebounded sharply after the CPI release, with the 10-year Treasury yield rising about 10 basis points before falling back to 5.209%. A stronger dollar will increase the cost for overseas buyers to purchase gold; while higher yields will increase the opportunity cost of holding gold—gold itself does not generate interest income. Tensions in the Middle East are pushing up energy prices, remaining a significant driver of inflation. Oil supply continues to face potential risks, and high fuel costs may keep inflation above the Fed's 2% target for a longer period. Against this backdrop, the market expects the Fed to maintain its tight monetary policy stance. The money market is betting that the Fed will raise interest rates three more times by the end of 2027. According to the CME FedWatch Tool, traders are currently pricing in a 37% probability of a rate hike at the Fed's October 27-28 meeting, compared to only 22% before the CPI data release; the probability of a December rate hike is close to 95%. New York Fed President John Williams stated on Tuesday that 2026 "might be appropriate for another rate hike." However, he currently believes that further rate hikes are unnecessary in 2027 and expects inflation to fall back towards the 2% target next year. Technical analysis: Spot gold is maintaining a range-bound trading pattern below key daily moving averages. On the daily chart, spot gold continues its downward trend, having broken below the 50-day, 100-day, and 200-day simple moving averages. Market momentum is weak, with the Relative Strength Index (RSI) hovering around 38 and the MACD indicator showing a slight negative value. This indicates that although gold prices have been trading within a range recently, bears still hold a slight advantage. Initial resistance is at the psychological level of $4200, followed by the 100-day moving average at $4249 and the 50-day moving average at $4336. A stronger rebound would face resistance at the $4400 level, followed by the 200-day moving average at $4525. On the downside, a decisive break below $4100 would open up downside potential towards the $4000-$3950 support zone.
- Risk Warning and Disclaimer
- The market involves risk, and trading may not be suitable for all investors. This article is for reference only and does not constitute personal investment advice, nor does it take into account certain users’ specific investment objectives, financial situation, or other needs. Any investment decisions made based on this information are at your own risk.