"Mr. Inflation's" Interpretation of the September 2026 CPI
2026-10-15 00:22:19
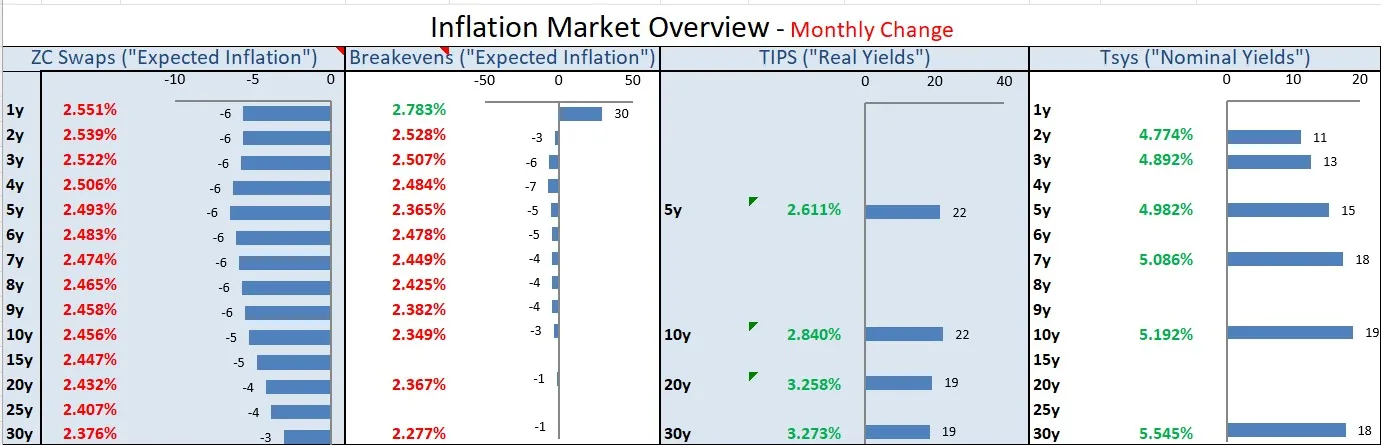
Another CPI report has been released. The data for the next two months following this report will be particularly noteworthy: the government shutdown severely disrupted the year-on-year base for October 2025 (data for that month is missing) and November 2025 (the November data used some special assumptions about October). However, at this stage, we are still calculating the year-on-year figures based on existing data, which is still somewhat advantageous.  As you may recall, last month's CPI data exceeded expectations, but this was mainly due to long-tail items (such as mobile communication services). The median CPI did not significantly exceed expectations, and the overall report was relatively mild. Even so, the Federal Reserve still raised interest rates, indicating that this rate hike was already within market expectations—the Fed was not unaware that the data increase was mainly due to one-off factors. But conversely… could last month's anomaly actually be due to the data being too low? This is precisely the question we will discuss today. The market's previous consensus expectation for September's CPI was: overall CPI +0.57% month-on-month, influenced by a renewed rise in energy prices; core CPI +0.22% month-on-month. Year-on-year expectations were for 3.6% and 2.5% respectively, with the rise in core inflation mainly due to base effects. At the market level: inflation swap rates declined this month, but US Treasury yields rose. This means that the increase in real yields exceeded that of nominal yields.
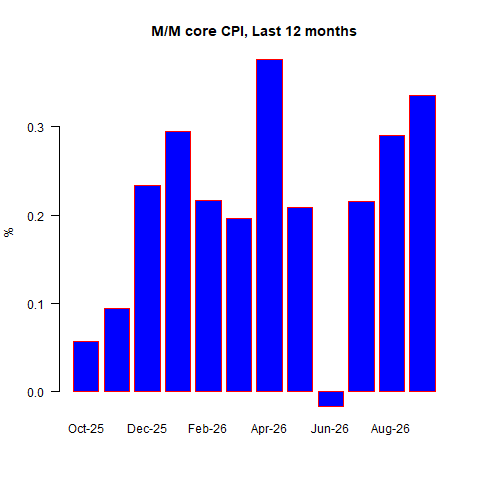
  The final September data was stronger than expected. Overall CPI rose 0.649% month-on-month (3.7% year-on-year), and core CPI rose 0.335% month-on-month (2.6% year-on-year). The following chart shows the core CPI data for the past 12 months:
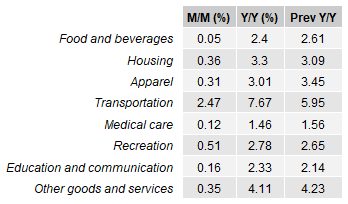
  The food and beverage sub-sector saw a rare decline this month, but inflation rose in housing, clothing, transportation (excluding fuel), and leisure services.
  Prices of core goods increased by 0.74% year-on-year; prices of core services increased by 3.15% year-on-year.
 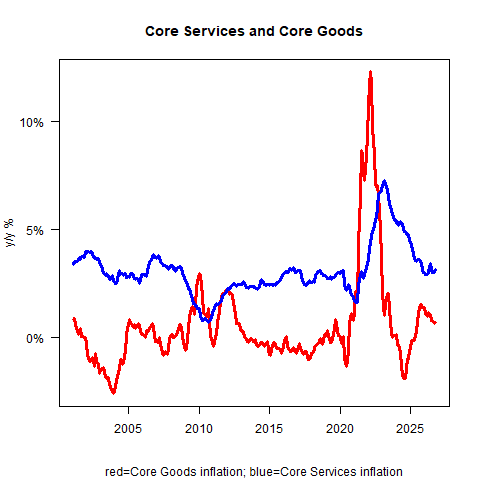 I'm not happy to see the decline in core services stagnate. Part of this is still due to one-off factors—the cost pressures of bulk commodities are included in service categories (such as airfares), but a significant portion is due to real cost transmission. Rent is at least part of the reason, and the trend in the following chart is equally worrying. Owner-occupied housing rent (primary residence rent) increased by 0.25% month-on-month and 2.78% year-on-year; Owner-Equivalent Rent (OER) increased by 0.35% month-on-month and 3.28% year-on-year.
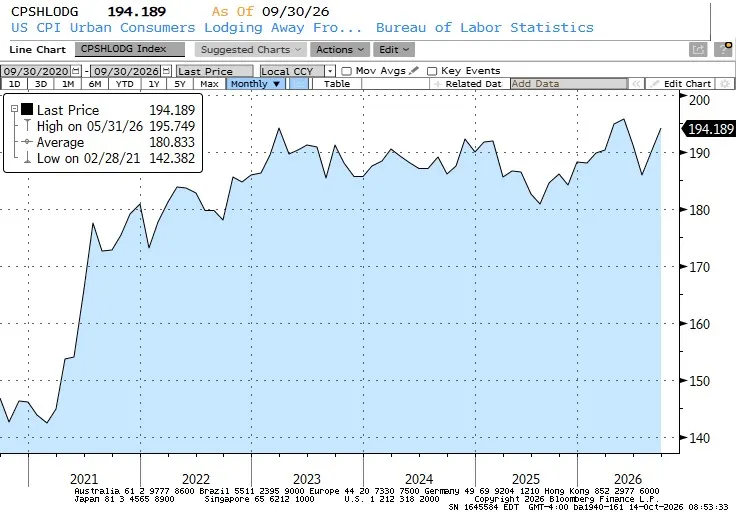
 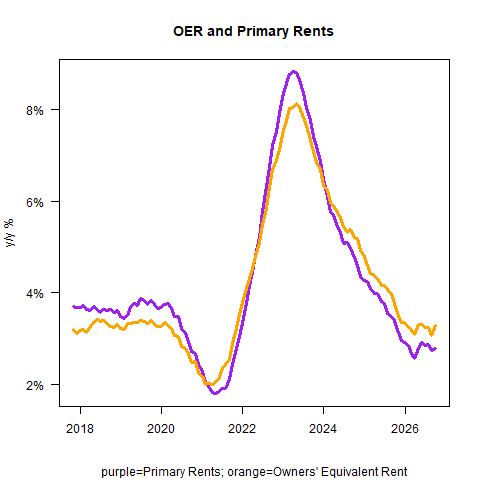 As mentioned earlier, the rise in core inflation last month was not a strong alarm, as the increase was concentrated in long-tail items, while the data for slow-changing categories like rent was relatively low. The low rent data last month now appears to be a one-off exception. Primary residence rent: September +0.17%, October +0.25%; landlord equivalent rent: September +0.19%, October +0.35%. This inflation increase has a broad scope. Airfares +1.16% month-on-month; accommodation +2.04% month-on-month; used car/truck year-on-year +0.67%; new car/truck month-on-month +0.2%. The continued rise in accommodation is noteworthy; this sub-category usually fluctuates, but it has strengthened consistently in the past two months. In July, hotel prices seemed to have returned to the range of the past few years, but now they have broken out of that range and continue to rise (see the accommodation price level chart below). Given the continued rise in hotel staff wages and other operating costs, this result is not surprising.
  Let's look at the median CPI. My estimate for the latest figure is a month-on-month increase of 0.282%, and a year-on-year increase from 2.58% to 2.66%. The trend is negative, and the base effect will continue to push this indicator higher in the coming months.
 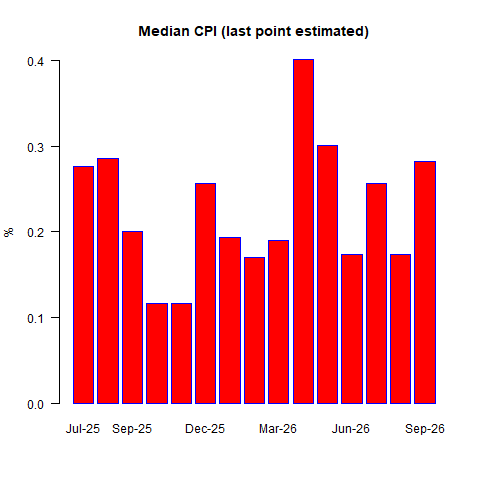 In summary: last month's data was acceptable because the median CPI was low, indicating that the increase came from the long tail of components; however, this month's situation is more worrying, with the median CPI rebounding sharply. Based on this month's median CPI (my estimate), compounded over 12 months, the corresponding year-on-year growth is 3.4%. Please remember this figure. None of the major macroeconomic components of the CPI performed well. New readers can learn that the four major components each roughly account for a quarter of the CPI weight. Sorted from highest to lowest volatility: food and energy, core goods, core services excluding rent (i.e., super core inflation), and housing rent.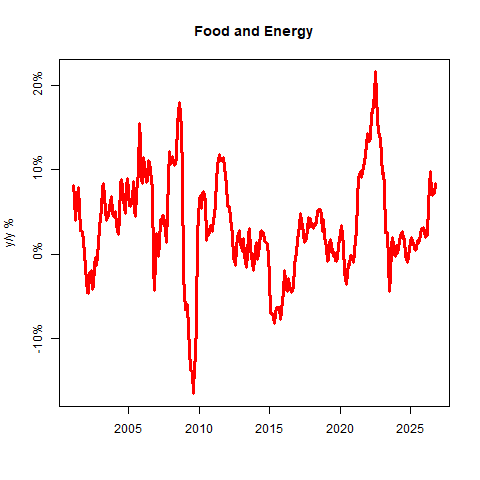
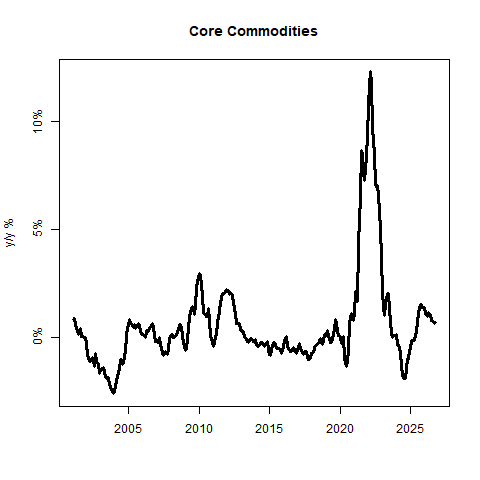
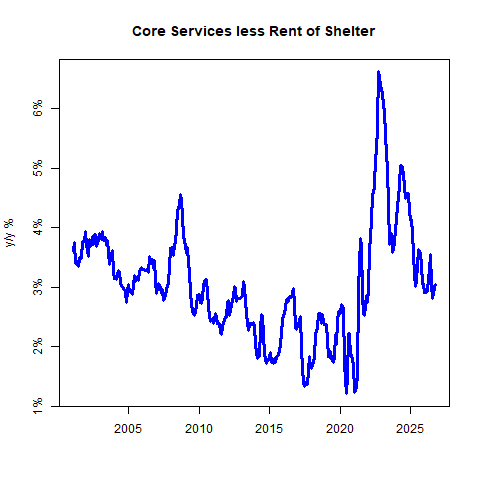
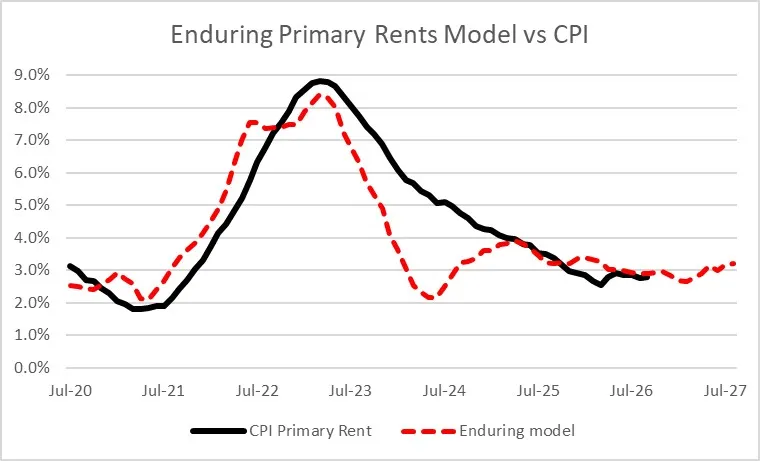
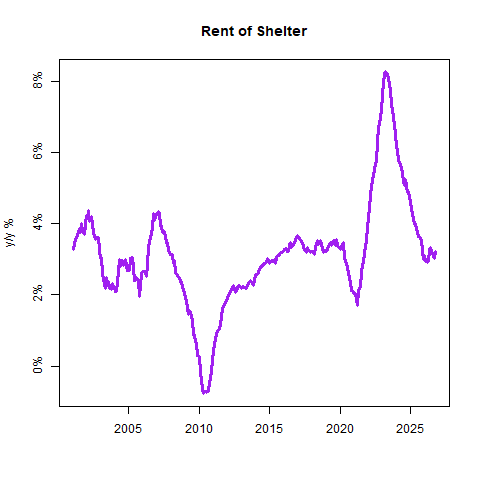 To be honest, in this seemingly pessimistic data, I can't find many factors that can alleviate inflation concerns. Some might say that core inflation, excluding housing, only rose slightly year-on-year from 1.98% to 2.04%. However, this sub-item still rose 0.29% month-on-month. The slight decline in core commodity inflation is a good sign, but remember: to achieve the 2% inflation target, core commodities need to enter deflation, and the current decline is slower than the market expected. (My personal judgment is that deep deflation in core commodities is unlikely in the short term; although it may occur in the long term, deglobalization will continue to exert upward pressure, just as globalization suppressed inflation in the past.) Let me compare the actual rent data with the model forecast. On the one hand, because I really like this chart, and on the other hand, to remind everyone: although rents rose sharply month-on-month this month and were weaker last month, the long-term trend of rents still conforms to our model expectations. It should be noted that rents will face some upward pressure next year.
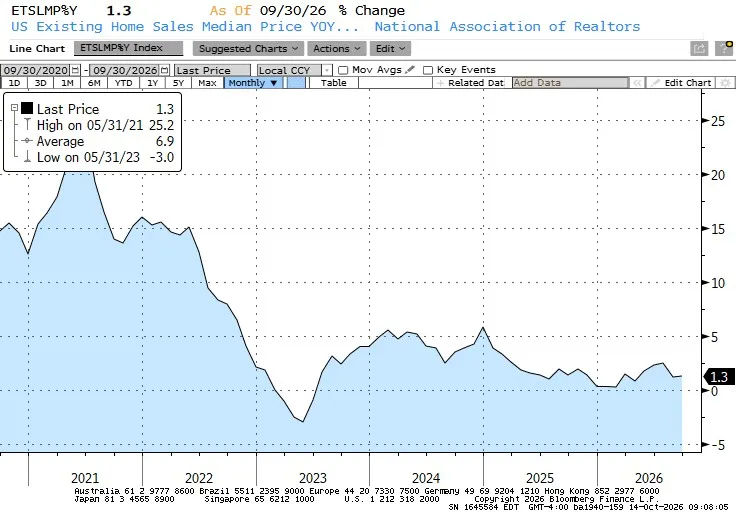
  Continuing with housing-related indicators: Existing home prices rose only 1.3% year-on-year. Some forecasters use lagged home prices to build rent models (this method is effective in a low and stable inflation environment; however, we believe that modeling based on landlord operating costs is more accurate). Here's a reminder: don't confuse housing sales volume with home prices. As mortgage rates rise, home sales will lag. But the core driver of home prices is the overall price level. Even with an oversupply of housing, real home prices can fall (as they are currently, with home price increases lagging behind inflation), but in an environment where overall inflation is above 3%, nominal home prices are unlikely to fall significantly.
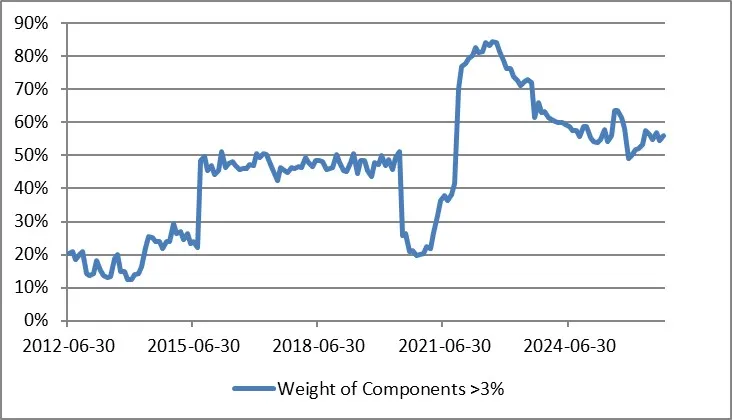
  Let's examine the breadth of inflation distribution. This explains the predicament of "inflation failing to reach the target": The chart below shows the weighting of CPI components with year-on-year increases exceeding 3%. Since the Federal Reserve began large-scale money printing, the year-on-year price increases for most commodities have been above 3%. This percentage peaked a few years ago but has now stabilized above 50%.
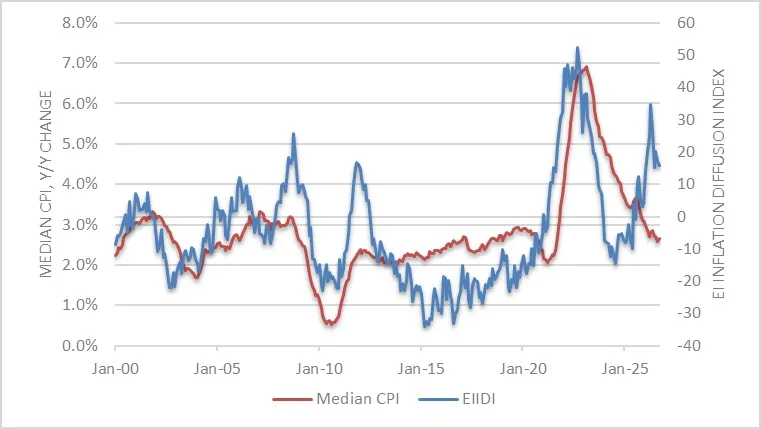
  The chart below shows the Enduring Investments Inflation Diffusion Index, which yields similar conclusions: underlying inflation momentum has stabilized, but remains above the Federal Reserve's ideal range. This trend suggests that median inflation is likely to return to the upper-middle 3% range within the next year or so.
  My long-held view is that after a temporary decline in inflation driven by factors such as rent and government shutdowns, the median CPI will eventually fall to around 3.5%, approaching 4%. This forecast now seems slightly high, but median inflation remaining in the mid-3% range is still far higher than almost all institutional forecasts. In short: core PCE will not smoothly decline to 2%. This data will significantly increase market expectations for a Fed rate hike, just as the non-farm payroll report significantly lowered the probability of a rate hike. However, I believe the FOMC will not make a significant shift based on a single data point, at least I hope so. The underlying logic has remained unchanged for a long time: the rapid monetary expansion during the COVID-19 pandemic pushed up inflation, and as money supply growth slows, inflation is gradually declining from extremely high levels. The solution to inflation is quantitative tightening and reducing money supply growth, not continued interest rate hikes. However, many still believe that economic growth and growth expectations are the root cause of inflation, thus requiring interest rate hikes to cool the economy. Incidentally, the Nobel Prize in Economics was recently awarded to Woodford, a representative of the New Keynesian school, who advocates that interest rate rules and expectations determine price levels (although much data does not support this conclusion). Even so, if this type of data continues to emerge, it means the Fed's work is far from over (if you previously thought the inflation problem was solved, you need to reconsider). The only question is how the Fed will respond. Warsh clearly advocated prioritizing balance sheet reduction and weakening the role of interest rate tools, but the last FOMC vote showed that he currently does not have enough influence to implement this plan. Next, the traditional FOMC needs to weigh: marginally slowing economic growth against sticky price pressures. A reasonable short-term strategy is to wait and see, ultimately depending on whether the employment data is worse than the inflation data—it's roughly that simple. I have no predictions for the employment data, but for some time, the inflation data is unlikely to bring any positive news.
As you may recall, last month's CPI data exceeded expectations, but this was mainly due to long-tail items (such as mobile communication services). The median CPI did not significantly exceed expectations, and the overall report was relatively mild. Even so, the Federal Reserve still raised interest rates, indicating that this rate hike was already within market expectations—the Fed was not unaware that the data increase was mainly due to one-off factors. But conversely… could last month's anomaly actually be due to the data being too low? This is precisely the question we will discuss today. The market's previous consensus expectation for September's CPI was: overall CPI +0.57% month-on-month, influenced by a renewed rise in energy prices; core CPI +0.22% month-on-month. Year-on-year expectations were for 3.6% and 2.5% respectively, with the rise in core inflation mainly due to base effects. At the market level: inflation swap rates declined this month, but US Treasury yields rose. This means that the increase in real yields exceeded that of nominal yields. The final September data was stronger than expected. Overall CPI rose 0.649% month-on-month (3.7% year-on-year), and core CPI rose 0.335% month-on-month (2.6% year-on-year). The following chart shows the core CPI data for the past 12 months: The food and beverage sub-sector saw a rare decline this month, but inflation rose in housing, clothing, transportation (excluding fuel), and leisure services. Prices of core goods increased by 0.74% year-on-year; prices of core services increased by 3.15% year-on-year. I'm not happy to see the decline in core services stagnate. Part of this is still due to one-off factors—the cost pressures of bulk commodities are included in service categories (such as airfares), but a significant portion is due to real cost transmission. Rent is at least part of the reason, and the trend in the following chart is equally worrying. Owner-occupied housing rent (primary residence rent) increased by 0.25% month-on-month and 2.78% year-on-year; Owner-Equivalent Rent (OER) increased by 0.35% month-on-month and 3.28% year-on-year. As mentioned earlier, the rise in core inflation last month was not a strong alarm, as the increase was concentrated in long-tail items, while the data for slow-changing categories like rent was relatively low. The low rent data last month now appears to be a one-off exception. Primary residence rent: September +0.17%, October +0.25%; landlord equivalent rent: September +0.19%, October +0.35%. This inflation increase has a broad scope. Airfares +1.16% month-on-month; accommodation +2.04% month-on-month; used car/truck year-on-year +0.67%; new car/truck month-on-month +0.2%. The continued rise in accommodation is noteworthy; this sub-category usually fluctuates, but it has strengthened consistently in the past two months. In July, hotel prices seemed to have returned to the range of the past few years, but now they have broken out of that range and continue to rise (see the accommodation price level chart below). Given the continued rise in hotel staff wages and other operating costs, this result is not surprising. Let's look at the median CPI. My estimate for the latest figure is a month-on-month increase of 0.282%, and a year-on-year increase from 2.58% to 2.66%. The trend is negative, and the base effect will continue to push this indicator higher in the coming months. In summary: last month's data was acceptable because the median CPI was low, indicating that the increase came from the long tail of components; however, this month's situation is more worrying, with the median CPI rebounding sharply. Based on this month's median CPI (my estimate), compounded over 12 months, the corresponding year-on-year growth is 3.4%. Please remember this figure. None of the major macroeconomic components of the CPI performed well. New readers can learn that the four major components each roughly account for a quarter of the CPI weight. Sorted from highest to lowest volatility: food and energy, core goods, core services excluding rent (i.e., super core inflation), and housing rent. To be honest, in this seemingly pessimistic data, I can't find many factors that can alleviate inflation concerns. Some might say that core inflation, excluding housing, only rose slightly year-on-year from 1.98% to 2.04%. However, this sub-item still rose 0.29% month-on-month. The slight decline in core commodity inflation is a good sign, but remember: to achieve the 2% inflation target, core commodities need to enter deflation, and the current decline is slower than the market expected. (My personal judgment is that deep deflation in core commodities is unlikely in the short term; although it may occur in the long term, deglobalization will continue to exert upward pressure, just as globalization suppressed inflation in the past.) Let me compare the actual rent data with the model forecast. On the one hand, because I really like this chart, and on the other hand, to remind everyone: although rents rose sharply month-on-month this month and were weaker last month, the long-term trend of rents still conforms to our model expectations. It should be noted that rents will face some upward pressure next year. Continuing with housing-related indicators: Existing home prices rose only 1.3% year-on-year. Some forecasters use lagged home prices to build rent models (this method is effective in a low and stable inflation environment; however, we believe that modeling based on landlord operating costs is more accurate). Here's a reminder: don't confuse housing sales volume with home prices. As mortgage rates rise, home sales will lag. But the core driver of home prices is the overall price level. Even with an oversupply of housing, real home prices can fall (as they are currently, with home price increases lagging behind inflation), but in an environment where overall inflation is above 3%, nominal home prices are unlikely to fall significantly. Let's examine the breadth of inflation distribution. This explains the predicament of "inflation failing to reach the target": The chart below shows the weighting of CPI components with year-on-year increases exceeding 3%. Since the Federal Reserve began large-scale money printing, the year-on-year price increases for most commodities have been above 3%. This percentage peaked a few years ago but has now stabilized above 50%. The chart below shows the Enduring Investments Inflation Diffusion Index, which yields similar conclusions: underlying inflation momentum has stabilized, but remains above the Federal Reserve's ideal range. This trend suggests that median inflation is likely to return to the upper-middle 3% range within the next year or so. My long-held view is that after a temporary decline in inflation driven by factors such as rent and government shutdowns, the median CPI will eventually fall to around 3.5%, approaching 4%. This forecast now seems slightly high, but median inflation remaining in the mid-3% range is still far higher than almost all institutional forecasts. In short: core PCE will not smoothly decline to 2%. This data will significantly increase market expectations for a Fed rate hike, just as the non-farm payroll report significantly lowered the probability of a rate hike. However, I believe the FOMC will not make a significant shift based on a single data point, at least I hope so. The underlying logic has remained unchanged for a long time: the rapid monetary expansion during the COVID-19 pandemic pushed up inflation, and as money supply growth slows, inflation is gradually declining from extremely high levels. The solution to inflation is quantitative tightening and reducing money supply growth, not continued interest rate hikes. However, many still believe that economic growth and growth expectations are the root cause of inflation, thus requiring interest rate hikes to cool the economy. Incidentally, the Nobel Prize in Economics was recently awarded to Woodford, a representative of the New Keynesian school, who advocates that interest rate rules and expectations determine price levels (although much data does not support this conclusion). Even so, if this type of data continues to emerge, it means the Fed's work is far from over (if you previously thought the inflation problem was solved, you need to reconsider). The only question is how the Fed will respond. Warsh clearly advocated prioritizing balance sheet reduction and weakening the role of interest rate tools, but the last FOMC vote showed that he currently does not have enough influence to implement this plan. Next, the traditional FOMC needs to weigh: marginally slowing economic growth against sticky price pressures. A reasonable short-term strategy is to wait and see, ultimately depending on whether the employment data is worse than the inflation data—it's roughly that simple. I have no predictions for the employment data, but for some time, the inflation data is unlikely to bring any positive news.
- Risk Warning and Disclaimer
- The market involves risk, and trading may not be suitable for all investors. This article is for reference only and does not constitute personal investment advice, nor does it take into account certain users’ specific investment objectives, financial situation, or other needs. Any investment decisions made based on this information are at your own risk.