US Treasury long-term yields pullback from highs: a technical correction following the inflation shock and a safe-haven trade.
2026-10-15 18:04:18
On Thursday (October 15), the yield on the 10-year U.S. Treasury note fell significantly to around 5.087% during the session, hitting a three-week low, a clear decline from the previous day's high of over 5.3%. This decline in U.S. Treasury yields is not due to a shift in monetary policy fundamentals towards easing, but rather a technical correction from high levels caused by the convergence of multiple short-term factors: the market repricing better-than-expected CPI data, risk asset sell-offs triggering safe-haven buying, falling oil prices easing inflation expectations, and cautious statements from Federal Reserve officials all contributing to the decline.  Inflation Data Shock Digested: Rate Hike Expectations Quickly Corrected. The US September CPI data released on October 14th initially disrupted the market, with the CPI rising to 3.7% year-on-year, higher than the market expectation of 3.6% and also higher than August's 3.4%. Core CPI was also relatively strong. Immediately after the data release, the market quickly raised its estimate of the probability of a Fed rate hike, and the 10-year Treasury yield surged past 5.3%, with trading funds betting on a possible rate hike at the October FOMC meeting, briefly pushing the probability of a rate hike close to 50%. After a day of review and digestion, the market reinterpreted the inflation data structure, judging that the direct impact of this CPI rebound on the October FOMC meeting was limited. In terms of trading, the probability of a Fed rate hike in October fell back to about 29%, with some of the previously traded rate hike expectations being priced in, leading to a rebound in Treasury prices and a decline in yields. A market consensus is gradually forming: a single instance of strong inflation data is insufficient to drive the Fed to immediately take tightening action; policy decisions still require more continuous data to verify inflation stickiness. Risk appetite declines, safe-haven funds flow into US Treasuries The sharp sell-off in risky US stocks is the core driver suppressing long-term US Treasury yields. Global stock markets are under pressure, with technology and AI sectors being the hardest hit, and Nasdaq futures continuing to weaken. Market concerns arise that in an environment of persistently high interest rates, the high debt burden incurred by AI companies during their early expansion will lead to repayment pressure and challenge profit expectations. Funds are beginning to withdraw from the equity market and shift to traditional safe-haven assets like Treasury bonds. Bond prices and yields move inversely; continued safe-haven buying pushes up US Treasury prices, further depressing long-term yields. This market movement exhibits a certain counterintuitive characteristic: strong inflation data should be bearish for bonds, but panic selling in the equity market has created a stronger force, dominating short-term US Treasury pricing. Lower oil prices ease inflationary pressure expectations Energy prices have been a significant driver of the current rebound in US inflation, and the recent decline in oil prices has helped the market lower its medium- to long-term inflation concerns. The reduced contribution of the energy component to CPI has lowered the tail risk of persistently rising inflation, weakening the underlying logic for continued long-term interest rate increases and providing support for the pullback in US Treasury yields. In a high-interest-rate environment, changes in commodity prices directly alter market assessments of the inflation path, and declining oil prices have eased the pressure on the Federal Reserve to continue tightening. Fed officials have stated: awaiting data, holding off on action . Recently, Fed officials have signaled caution. Policymakers such as Bowman and Daly have stated that the Fed can wait for clearer economic data before deciding on policy actions at the October meeting, without rushing to raise interest rates. These statements have weakened market expectations for an immediate rate hike this month, limiting the potential for further increases in long-term yields. The core policy approach is: inflation remains above target, but there is no rush to tighten immediately after a single inflation data release, maintaining an observation window to assess the transmission effects of previous rate hikes. Outlook: Short-term pullback, trend not reversed. Overall, the recent decline in the US 10-year Treasury yield is a high-level adjustment, not a shift towards a looser economic environment. In recent weeks, long-term US Treasury yields have risen to multi-year highs due to a combination of factors, including rebounding inflation, rising oil prices, increased US debt supply, and expectations of interest rate hikes. The current decline is merely a technical correction after the rapid rise. Going forward, the market will focus on key economic data such as US retail sales and PPI, as the strength or weakness of these data will again influence the Federal Reserve's policy pricing. Investors need to continuously monitor market developments and be wary of the risk of another rebound in long-term interest rates. Technical Analysis
 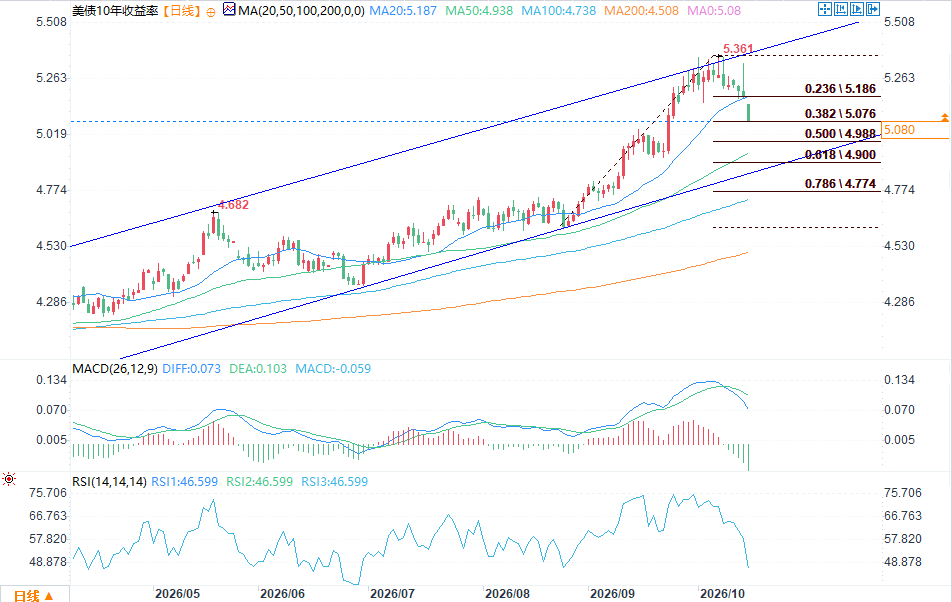 (Source: EasyTrade) The 10-year US Treasury yield daily chart shows a one-sided upward trend since the end of August, reaching a high of 5.361%. Currently, the market is undergoing a technical correction, with the price falling back to the 38.2% Fibonacci retracement level of this upward move, a relatively normal pullback within an uptrend. From a candlestick pattern perspective, the consecutive long upper shadows during the upward surge indicate accumulating selling pressure and significant resistance to further upward breakthroughs. Recent candlesticks show a gap-down opening, indicating a release of short-term bearish pressure and a temporary slowdown in the upward momentum. However, based solely on candlestick signals, it's premature to conclude that the trend has reversed. The moving average system remains bullish. While the current price has only briefly broken below the 20-day moving average (MA20), it remains significantly above the 50-day moving average (MA50), indicating that the medium- to long-term upward structure remains intact. The breach of short-term moving averages primarily reflects weakening short-term market sentiment, but the medium-term trend support remains. Once the short-term correction is completed, the existing upward trend still has the potential to continue. On the auxiliary indicator level, the MACD shows the DIFF line crossing below the DEA line, with the histogram turning green, indicating weakening momentum. The RSI has also fallen from its high to 46.599, cooling down from its previous overbought state. These indicators simultaneously confirm that we are currently in a pullback phase, but have not yet entered a deep downtrend, and there is still a possibility of further downward testing of support. Regarding support and resistance, the 38.2% Fibonacci retracement level at 5.076 is the first key support level. If it continues to weaken, the price will further test the 5.0% level, with the core support level around 4.938 (MA50). Resistance is concentrated at the MA20 at 5.187 and the previous high of 5.361%. Based on the overall trend, this pullback is likely a short-term consolidation within an uptrend. If it can stabilize around 5.0 or near the MA50, and the indicators complete their correction, there is a high probability that the uptrend will resume and challenge the previous high again. Only if the price effectively breaks below 4.938 and continues to close below that level should the validity of this uptrend be reassessed.
Inflation Data Shock Digested: Rate Hike Expectations Quickly Corrected. The US September CPI data released on October 14th initially disrupted the market, with the CPI rising to 3.7% year-on-year, higher than the market expectation of 3.6% and also higher than August's 3.4%. Core CPI was also relatively strong. Immediately after the data release, the market quickly raised its estimate of the probability of a Fed rate hike, and the 10-year Treasury yield surged past 5.3%, with trading funds betting on a possible rate hike at the October FOMC meeting, briefly pushing the probability of a rate hike close to 50%. After a day of review and digestion, the market reinterpreted the inflation data structure, judging that the direct impact of this CPI rebound on the October FOMC meeting was limited. In terms of trading, the probability of a Fed rate hike in October fell back to about 29%, with some of the previously traded rate hike expectations being priced in, leading to a rebound in Treasury prices and a decline in yields. A market consensus is gradually forming: a single instance of strong inflation data is insufficient to drive the Fed to immediately take tightening action; policy decisions still require more continuous data to verify inflation stickiness. Risk appetite declines, safe-haven funds flow into US Treasuries The sharp sell-off in risky US stocks is the core driver suppressing long-term US Treasury yields. Global stock markets are under pressure, with technology and AI sectors being the hardest hit, and Nasdaq futures continuing to weaken. Market concerns arise that in an environment of persistently high interest rates, the high debt burden incurred by AI companies during their early expansion will lead to repayment pressure and challenge profit expectations. Funds are beginning to withdraw from the equity market and shift to traditional safe-haven assets like Treasury bonds. Bond prices and yields move inversely; continued safe-haven buying pushes up US Treasury prices, further depressing long-term yields. This market movement exhibits a certain counterintuitive characteristic: strong inflation data should be bearish for bonds, but panic selling in the equity market has created a stronger force, dominating short-term US Treasury pricing. Lower oil prices ease inflationary pressure expectations Energy prices have been a significant driver of the current rebound in US inflation, and the recent decline in oil prices has helped the market lower its medium- to long-term inflation concerns. The reduced contribution of the energy component to CPI has lowered the tail risk of persistently rising inflation, weakening the underlying logic for continued long-term interest rate increases and providing support for the pullback in US Treasury yields. In a high-interest-rate environment, changes in commodity prices directly alter market assessments of the inflation path, and declining oil prices have eased the pressure on the Federal Reserve to continue tightening. Fed officials have stated: awaiting data, holding off on action . Recently, Fed officials have signaled caution. Policymakers such as Bowman and Daly have stated that the Fed can wait for clearer economic data before deciding on policy actions at the October meeting, without rushing to raise interest rates. These statements have weakened market expectations for an immediate rate hike this month, limiting the potential for further increases in long-term yields. The core policy approach is: inflation remains above target, but there is no rush to tighten immediately after a single inflation data release, maintaining an observation window to assess the transmission effects of previous rate hikes. Outlook: Short-term pullback, trend not reversed. Overall, the recent decline in the US 10-year Treasury yield is a high-level adjustment, not a shift towards a looser economic environment. In recent weeks, long-term US Treasury yields have risen to multi-year highs due to a combination of factors, including rebounding inflation, rising oil prices, increased US debt supply, and expectations of interest rate hikes. The current decline is merely a technical correction after the rapid rise. Going forward, the market will focus on key economic data such as US retail sales and PPI, as the strength or weakness of these data will again influence the Federal Reserve's policy pricing. Investors need to continuously monitor market developments and be wary of the risk of another rebound in long-term interest rates. Technical Analysis (Source: EasyTrade) The 10-year US Treasury yield daily chart shows a one-sided upward trend since the end of August, reaching a high of 5.361%. Currently, the market is undergoing a technical correction, with the price falling back to the 38.2% Fibonacci retracement level of this upward move, a relatively normal pullback within an uptrend. From a candlestick pattern perspective, the consecutive long upper shadows during the upward surge indicate accumulating selling pressure and significant resistance to further upward breakthroughs. Recent candlesticks show a gap-down opening, indicating a release of short-term bearish pressure and a temporary slowdown in the upward momentum. However, based solely on candlestick signals, it's premature to conclude that the trend has reversed. The moving average system remains bullish. While the current price has only briefly broken below the 20-day moving average (MA20), it remains significantly above the 50-day moving average (MA50), indicating that the medium- to long-term upward structure remains intact. The breach of short-term moving averages primarily reflects weakening short-term market sentiment, but the medium-term trend support remains. Once the short-term correction is completed, the existing upward trend still has the potential to continue. On the auxiliary indicator level, the MACD shows the DIFF line crossing below the DEA line, with the histogram turning green, indicating weakening momentum. The RSI has also fallen from its high to 46.599, cooling down from its previous overbought state. These indicators simultaneously confirm that we are currently in a pullback phase, but have not yet entered a deep downtrend, and there is still a possibility of further downward testing of support. Regarding support and resistance, the 38.2% Fibonacci retracement level at 5.076 is the first key support level. If it continues to weaken, the price will further test the 5.0% level, with the core support level around 4.938 (MA50). Resistance is concentrated at the MA20 at 5.187 and the previous high of 5.361%. Based on the overall trend, this pullback is likely a short-term consolidation within an uptrend. If it can stabilize around 5.0 or near the MA50, and the indicators complete their correction, there is a high probability that the uptrend will resume and challenge the previous high again. Only if the price effectively breaks below 4.938 and continues to close below that level should the validity of this uptrend be reassessed.
- Risk Warning and Disclaimer
- The market involves risk, and trading may not be suitable for all investors. This article is for reference only and does not constitute personal investment advice, nor does it take into account certain users’ specific investment objectives, financial situation, or other needs. Any investment decisions made based on this information are at your own risk.