Why is gold still struggling to maintain its upward trend?
2026-10-19 15:00:20
On Monday, October 19th, spot gold prices traded below $4200, currently hovering around $4180, with a slight upward movement during the day. The market is caught in a tug-of-war between falling US Treasury yields, lower oil prices, and shifting geopolitical factors, with the pricing logic of non-interest-bearing assets being influenced by a combination of opportunity cost and inflation expectations. 
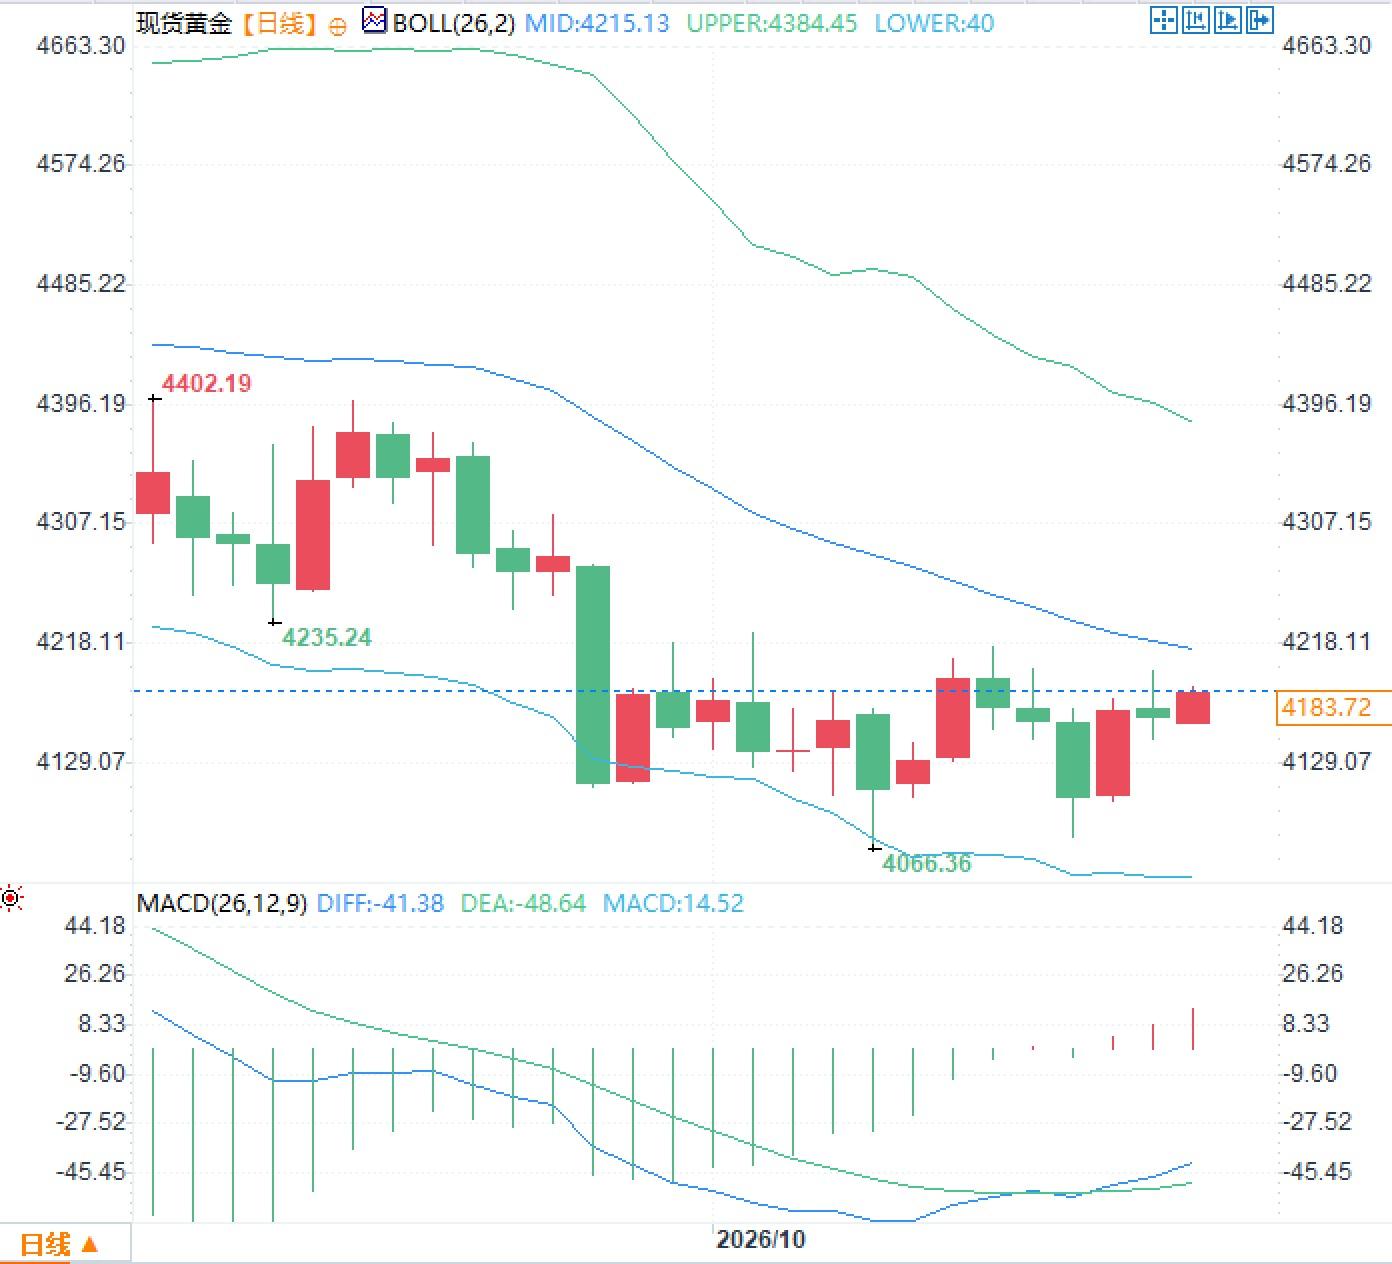
Spot gold trades in a volatile pattern driven by yield and oil price factors.
Spot gold attempted a rebound from recent lows, but prices fluctuated below $4,200, with limited upward momentum. Falling US Treasury yields and lower oil prices continued to limit the dollar's upside, thus reducing the opportunity cost of holding non-yielding gold and providing some support for prices. Meanwhile, the safe-haven premium driven by geopolitical factors has diminished, maintaining a balance between bullish and bearish forces within this framework. Lower yields affect gold pricing through the real interest rate channel, while falling oil prices suppress the pricing of further tightening by the Federal Reserve through inflation expectations. These two factors together constitute the main background for the current difficulty in sustainably breaking through key levels.Federal Reserve Policy Signals and Yield Dynamics
Federal Reserve Chairman Kevin Warsh has remained silent on the interest rate path recently, and market pricing in an October rate hike has significantly decreased. This has put downward pressure on the overall US Treasury yield curve and indirectly supported non-yielding assets. Warsh's remarks in related forums have been generally constructive but cautious. He acknowledged the "over-scarring" mentality following the global financial crisis, highlighting a continued risk aversion, while emphasizing structural growth and an investment boom driven by "good policies," suggesting no pre-committed urgency before the October and December meetings. Warsh viewed AI as a short-term demand catalyst, while noting the uncertainty surrounding its impact on employment. He also mentioned plans to conduct on-site hearings on AI and form a new Fed task force, reflecting that the central bank views technology as both a supporter of data-dependent policies and a potential source of tail risk. The decline in yields has reduced the opportunity cost of holding non-yielding assets, providing some price support for spot gold.An observation of the decline in oil prices and geopolitical factors.
Oil prices retreated from recent highs, partly due to the US waiver of energy sanctions and tariffs on Russia, an arrangement aimed at encouraging continued participation in peace talks in Ukraine. This change eased some inflation concerns and lowered market expectations for further tightening by the Federal Reserve, thus supporting non-yielding gold. The waiver offset supply concerns stemming from a report by Iran that an oil tanker struck a mine in the Strait of Hormuz on Sunday. Ukrainian President Zelensky criticized the pressure, arguing that the US demanded Ukraine cease its attacks on Russian oil refineries and end the conflict as soon as possible under specific conditions. The decline in oil prices indirectly supported spot gold prices by influencing real interest rate expectations through inflation expectations, while the safe-haven premium driven by geopolitical factors diminished. Market focus shifted to marginal changes in supply and inflation expectations.Current pattern of technical indicators
The daily chart shows that spot gold prices are trading below the Bollinger Band middle line at $4215.13, with the upper line around $4384.45. The price is currently around $4180, between the middle and lower bands. The MACD indicator shows DIFF at -41.38, DEA at -48.64, and the MACD histogram at +14.52. The price is below the Bollinger Band middle line, while the MACD histogram has turned positive, and both DIFF and DEA remain below the zero line.Frequently Asked Questions
Question 1: Why does spot gold lack sustained upward momentum below $4200? Answer: Falling US Treasury yields and lower oil prices have limited the dollar's upward movement. Meanwhile, geopolitical safe-haven premiums have diminished, and the interplay of bullish and bearish factors has led to repeated price fluctuations in key areas. Question 2: How do Fed Chairman Warsh's comments affect market expectations for the interest rate path? Answer: Warsh's silence and cautious tone regarding the interest rate path have significantly reduced market pricing in an October rate hike. Falling yields have lowered the opportunity cost of non-yielding assets. Question 3: What logical impact does the decline in oil prices have on spot gold pricing? Answer: Oil prices fell due to energy sanctions exemptions, easing inflation concerns and reducing expectations of further tightening, indirectly supporting non-yielding gold through the real interest rate channel.- Risk Warning and Disclaimer
- The market involves risk, and trading may not be suitable for all investors. This article is for reference only and does not constitute personal investment advice, nor does it take into account certain users’ specific investment objectives, financial situation, or other needs. Any investment decisions made based on this information are at your own risk.