Gold may see a rebound in late October or early November.
2026-10-19 19:02:22
The current gold market is in a volatile phase, with both bullish and bearish factors at play. Spot gold prices are fluctuating between $4100 and $4200, pressured by both real interest rates and a temporarily stronger dollar, and supported by long-term safe-haven demand and central bank gold purchases. Considering factors such as Federal Reserve policy signals, US Treasury yield trends, inflation and economic data, the US dollar index, oil prices, and geopolitical factors, gold has the potential to rebound in late October or early November, and technically, it may test resistance levels near the 50-day and 100-day moving averages. The following analysis will delve into these factors from multiple perspectives.  The probability of a Fed rate hike in October has fallen significantly, limiting further hawkish hawkish stance. Last week, Fed Chairman Kevin Warsh's remarks at the IMF annual meeting in Bangkok became a key catalyst for a shift in market sentiment. Warsh pointed out that the global economic trend since the September rate hike has been "broadly in line" with the Fed's expectations, and explicitly refused to predict the outcome of the October 28th policy meeting, nor did he want to reveal the policy path for the remaining meetings this year. This statement was interpreted by the market as a signal of no rate hike in October. According to tools such as CME, the market's probability of a rate hike in October has rapidly fallen from about 27% before the speech to around 15%, with mainstream expectations shifting to a higher probability of another 25 basis point rate hike in December. Meanwhile, several Fed officials have recently become more cautious in their statements. San Francisco Fed President Daly stated that while further rate hikes may still be necessary, they are "not urgent," and there is time to observe more data; New York Fed President Williams and Vice Chairman Jefferson also signaled that there is "no need to rush into action." The dot plot shows that most officials expect at least one more rate hike this year, but with flexibility in the pace, reducing the necessity for consecutive rate hike meetings. Warsh's emphasis on data reliance and rejection of forward guidance since taking office has further reduced market pricing in an aggressively hawkish path. For gold, the marginal easing of short-term interest rate expectations directly reduces the opportunity cost of holding non-interest-bearing assets. If the October meeting confirms a pause, it will reinforce the narrative of "policy peak approaching," providing upward elasticity for gold prices. Two-year US Treasury yield and real interest rates: A clear downward trend this month The two-year US Treasury yield, highly correlated with short-term interest rate expectations, has generally declined this month. Falling from its late September high of around 4.88%-4.92% to the current range of approximately 4.72%-4.74%, it indicates a cooling of market pricing in further rapid tightening. As a policy-sensitive asset, the decline in the two-year yield often corresponds to easing pressure on real interest rates, which is one of the core variables in gold pricing. Combined with recent inflation and economic data, the US economy shows resilience but is not overheated. The labor market is nearing full employment overall, but some employment and wage data have shown signs of cooling; while inflation remains above the 2% target, evidence of improvement in the core trend is gradually accumulating. Warsh himself also mentioned that the underlying trend has shown "meaningful improvement." Against this backdrop, if subsequent data does not show a significant and unexpected surge, short-term US Treasury yields are unlikely to rise sharply further, and the interest rate pressure on gold will continue to weaken. US Dollar Index: Increased Probability of Correction After a Period of Highs The US dollar index recently climbed to around 103 (with a high close to 102.95), mainly driven by the relative economic and policy differences between the US and Europe, as well as uncertainty in the European situation. The dollar strengthened significantly against the euro. However, multiple factors are accumulating downward pressure. On the one hand, Bank of Japan officials have recently released hawkish signals. Policy Board member Junko Koeda stated that the neutral interest rate is likely to be well above 1%, and the current policy rate of around 1.25% still has room for upward adjustment, emphasizing that there should not be excessive caution on the issue of interest rate hikes. The market has priced in further action from the Bank of Japan around December. If the yen gains support as a result, it will weaken the upward momentum of the US dollar index. On the other hand, while uncertainties related to the European situation and energy are short-term positives for the US dollar, the euro and other non-US currencies may recover if geopolitical premiums stabilize or decline. Technically, the US dollar index has shown signs of being overbought at high levels, increasing the likelihood of a pullback to 101 or even lower. A weaker dollar will directly reduce the cost of gold priced in US dollars, becoming a significant driver of gold price rebounds. The recent significant pullback in technology stocks has been a major catalyst for accelerating the pressure on the dollar and the benefits for gold. Funds are withdrawing from overvalued technology growth stocks and shifting to safe-haven assets such as US Treasury bonds, directly pushing down US Treasury yields and weakening the dollar's safe-haven and interest rate differential support. Under this "seesaw effect" between stocks and bonds, the US dollar index has fallen from its high to around 101.8, potentially ending its previous weeks of continuous gains. The cooling of risk appetite brought about by the adjustment in technology stocks not only strengthens the recovery potential of non-US currencies but also reduces the cost of holding gold priced in US dollars. Crude oil prices are currently at high levels, limiting further upside potential . Currently, crude oil prices are relatively high: Brent crude has recently fluctuated between $107 and $110, while WTI is around $97 to $101. High oil prices push up inflation expectations through the energy channel, indirectly having a complex impact on gold—it may support gold prices through inflation expectations, or it may reinforce the Fed's hawkish stance, thereby suppressing gold prices. However, further significant upside potential is limited. From a supply perspective, in the two weeks leading up to the midterm elections (with the November 3rd midterm elections approaching), the US government has a strong incentive to take measures to increase crude oil supply or stabilize market expectations in order to stabilize the election and control inflation perceptions. Historical experience shows that political constraints during the election window often suppress the excessive development of geopolitical risk premiums. If oil prices stabilize at high levels or even decline slightly, it will alleviate concerns about runaway inflation, reduce the risk of rising real interest rates, and indirectly benefit gold. Geopolitical and political window: The demand for stability before the midterm elections is currently in a critical window about two weeks before the US midterm elections. From the perspective of stabilizing the election and controlling price pressures, the US government is motivated to adopt a pragmatic approach to energy supply and geopolitical risk management. This helps limit a one-sided surge in crude oil prices and reduces the sudden outbreak of extreme risk aversion. For gold, a moderate geopolitical premium provides bottom support, while the absence of extreme shocks is conducive to a smoother technical rebound in gold prices, rather than impulsive fluctuations. Technical Analysis and Overall Outlook: Path to test the MA50 and MA100
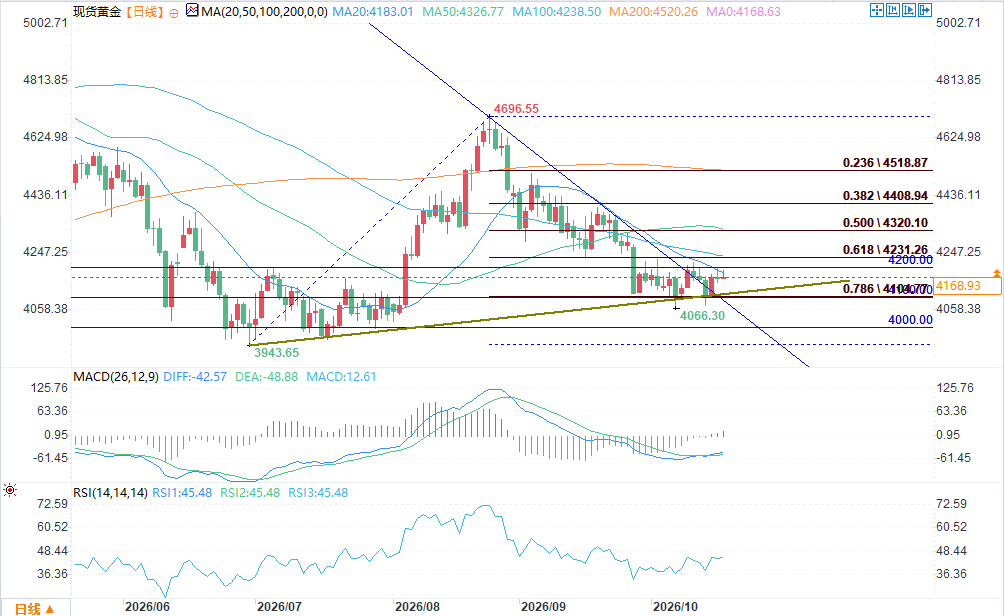 (US Dollar Index Daily Chart Source: FX678) Technically, gold has stabilized in a key support zone after a pullback. Short-term moving averages are converging, and the MACD bearish momentum is weakening, showing signs of a post-oversold recovery. The MA50 and MA100 serve as medium-term moving average resistance levels; if gold prices can effectively break through and hold above these levels, it will open up further upside potential. Combined with the aforementioned fundamental factors—cooling expectations of an October rate hike, declining short-term yields, a high-level pullback in the US dollar, limited upside for oil prices, and controlled risk premiums before the election—the probability of gold starting a phase of upward movement from late October to early November has increased. It should be emphasized that gold still faces constraints from the medium- to long-term interest rate environment and the resilience of the US dollar; the rebound may not be immediate and may be accompanied by volatility. Investors should pay attention to the results of the October interest rate meeting, subsequent inflation and employment data, the Bank of Japan's actions, and election-related political signals. If these variables evolve along their current paths, gold is expected to achieve an upward recovery and challenge the medium-term moving average target under the combined effect of multiple positive factors. Overall, the balance of power in the gold market is quietly tilting towards the bulls. The marginal easing of policy expectations and the temporary loosening of external constraints have created a favorable window for a rebound. If the above logic can be confirmed in the future, gold prices are expected to see a noteworthy upward trend.
The probability of a Fed rate hike in October has fallen significantly, limiting further hawkish hawkish stance. Last week, Fed Chairman Kevin Warsh's remarks at the IMF annual meeting in Bangkok became a key catalyst for a shift in market sentiment. Warsh pointed out that the global economic trend since the September rate hike has been "broadly in line" with the Fed's expectations, and explicitly refused to predict the outcome of the October 28th policy meeting, nor did he want to reveal the policy path for the remaining meetings this year. This statement was interpreted by the market as a signal of no rate hike in October. According to tools such as CME, the market's probability of a rate hike in October has rapidly fallen from about 27% before the speech to around 15%, with mainstream expectations shifting to a higher probability of another 25 basis point rate hike in December. Meanwhile, several Fed officials have recently become more cautious in their statements. San Francisco Fed President Daly stated that while further rate hikes may still be necessary, they are "not urgent," and there is time to observe more data; New York Fed President Williams and Vice Chairman Jefferson also signaled that there is "no need to rush into action." The dot plot shows that most officials expect at least one more rate hike this year, but with flexibility in the pace, reducing the necessity for consecutive rate hike meetings. Warsh's emphasis on data reliance and rejection of forward guidance since taking office has further reduced market pricing in an aggressively hawkish path. For gold, the marginal easing of short-term interest rate expectations directly reduces the opportunity cost of holding non-interest-bearing assets. If the October meeting confirms a pause, it will reinforce the narrative of "policy peak approaching," providing upward elasticity for gold prices. Two-year US Treasury yield and real interest rates: A clear downward trend this month The two-year US Treasury yield, highly correlated with short-term interest rate expectations, has generally declined this month. Falling from its late September high of around 4.88%-4.92% to the current range of approximately 4.72%-4.74%, it indicates a cooling of market pricing in further rapid tightening. As a policy-sensitive asset, the decline in the two-year yield often corresponds to easing pressure on real interest rates, which is one of the core variables in gold pricing. Combined with recent inflation and economic data, the US economy shows resilience but is not overheated. The labor market is nearing full employment overall, but some employment and wage data have shown signs of cooling; while inflation remains above the 2% target, evidence of improvement in the core trend is gradually accumulating. Warsh himself also mentioned that the underlying trend has shown "meaningful improvement." Against this backdrop, if subsequent data does not show a significant and unexpected surge, short-term US Treasury yields are unlikely to rise sharply further, and the interest rate pressure on gold will continue to weaken. US Dollar Index: Increased Probability of Correction After a Period of Highs The US dollar index recently climbed to around 103 (with a high close to 102.95), mainly driven by the relative economic and policy differences between the US and Europe, as well as uncertainty in the European situation. The dollar strengthened significantly against the euro. However, multiple factors are accumulating downward pressure. On the one hand, Bank of Japan officials have recently released hawkish signals. Policy Board member Junko Koeda stated that the neutral interest rate is likely to be well above 1%, and the current policy rate of around 1.25% still has room for upward adjustment, emphasizing that there should not be excessive caution on the issue of interest rate hikes. The market has priced in further action from the Bank of Japan around December. If the yen gains support as a result, it will weaken the upward momentum of the US dollar index. On the other hand, while uncertainties related to the European situation and energy are short-term positives for the US dollar, the euro and other non-US currencies may recover if geopolitical premiums stabilize or decline. Technically, the US dollar index has shown signs of being overbought at high levels, increasing the likelihood of a pullback to 101 or even lower. A weaker dollar will directly reduce the cost of gold priced in US dollars, becoming a significant driver of gold price rebounds. The recent significant pullback in technology stocks has been a major catalyst for accelerating the pressure on the dollar and the benefits for gold. Funds are withdrawing from overvalued technology growth stocks and shifting to safe-haven assets such as US Treasury bonds, directly pushing down US Treasury yields and weakening the dollar's safe-haven and interest rate differential support. Under this "seesaw effect" between stocks and bonds, the US dollar index has fallen from its high to around 101.8, potentially ending its previous weeks of continuous gains. The cooling of risk appetite brought about by the adjustment in technology stocks not only strengthens the recovery potential of non-US currencies but also reduces the cost of holding gold priced in US dollars. Crude oil prices are currently at high levels, limiting further upside potential . Currently, crude oil prices are relatively high: Brent crude has recently fluctuated between $107 and $110, while WTI is around $97 to $101. High oil prices push up inflation expectations through the energy channel, indirectly having a complex impact on gold—it may support gold prices through inflation expectations, or it may reinforce the Fed's hawkish stance, thereby suppressing gold prices. However, further significant upside potential is limited. From a supply perspective, in the two weeks leading up to the midterm elections (with the November 3rd midterm elections approaching), the US government has a strong incentive to take measures to increase crude oil supply or stabilize market expectations in order to stabilize the election and control inflation perceptions. Historical experience shows that political constraints during the election window often suppress the excessive development of geopolitical risk premiums. If oil prices stabilize at high levels or even decline slightly, it will alleviate concerns about runaway inflation, reduce the risk of rising real interest rates, and indirectly benefit gold. Geopolitical and political window: The demand for stability before the midterm elections is currently in a critical window about two weeks before the US midterm elections. From the perspective of stabilizing the election and controlling price pressures, the US government is motivated to adopt a pragmatic approach to energy supply and geopolitical risk management. This helps limit a one-sided surge in crude oil prices and reduces the sudden outbreak of extreme risk aversion. For gold, a moderate geopolitical premium provides bottom support, while the absence of extreme shocks is conducive to a smoother technical rebound in gold prices, rather than impulsive fluctuations. Technical Analysis and Overall Outlook: Path to test the MA50 and MA100 (US Dollar Index Daily Chart Source: FX678) Technically, gold has stabilized in a key support zone after a pullback. Short-term moving averages are converging, and the MACD bearish momentum is weakening, showing signs of a post-oversold recovery. The MA50 and MA100 serve as medium-term moving average resistance levels; if gold prices can effectively break through and hold above these levels, it will open up further upside potential. Combined with the aforementioned fundamental factors—cooling expectations of an October rate hike, declining short-term yields, a high-level pullback in the US dollar, limited upside for oil prices, and controlled risk premiums before the election—the probability of gold starting a phase of upward movement from late October to early November has increased. It should be emphasized that gold still faces constraints from the medium- to long-term interest rate environment and the resilience of the US dollar; the rebound may not be immediate and may be accompanied by volatility. Investors should pay attention to the results of the October interest rate meeting, subsequent inflation and employment data, the Bank of Japan's actions, and election-related political signals. If these variables evolve along their current paths, gold is expected to achieve an upward recovery and challenge the medium-term moving average target under the combined effect of multiple positive factors. Overall, the balance of power in the gold market is quietly tilting towards the bulls. The marginal easing of policy expectations and the temporary loosening of external constraints have created a favorable window for a rebound. If the above logic can be confirmed in the future, gold prices are expected to see a noteworthy upward trend.
- Risk Warning and Disclaimer
- The market involves risk, and trading may not be suitable for all investors. This article is for reference only and does not constitute personal investment advice, nor does it take into account certain users’ specific investment objectives, financial situation, or other needs. Any investment decisions made based on this information are at your own risk.