Gold ETFs have seen net inflows for 13 consecutive weeks, with global holdings reaching a record high. Has this altered the supply and demand balance of precious metals?
2026-10-19 19:06:20
On Monday, October 19th, spot gold stabilized around $4170 per ounce after previous fluctuations, with limited intraday volatility. Brent crude oil retreated slightly from its five-month high, last quoted at around $108 per barrel. The Federal Reserve will hold its policy meeting on October 27-28, and the market has priced in a rate hike of about 15%. Since the outbreak of conflicts in the Middle East in late February, energy supply disruptions have fueled inflation expectations and prompted major central banks to tighten policies, resulting in a clear inverse correlation between spot gold and crude oil prices. Meanwhile, US Treasury yields have fallen, and gold-backed ETFs have recorded net inflows for several consecutive weeks, with global holdings rising to near historical highs. 
The inverse relationship between crude oil and gold
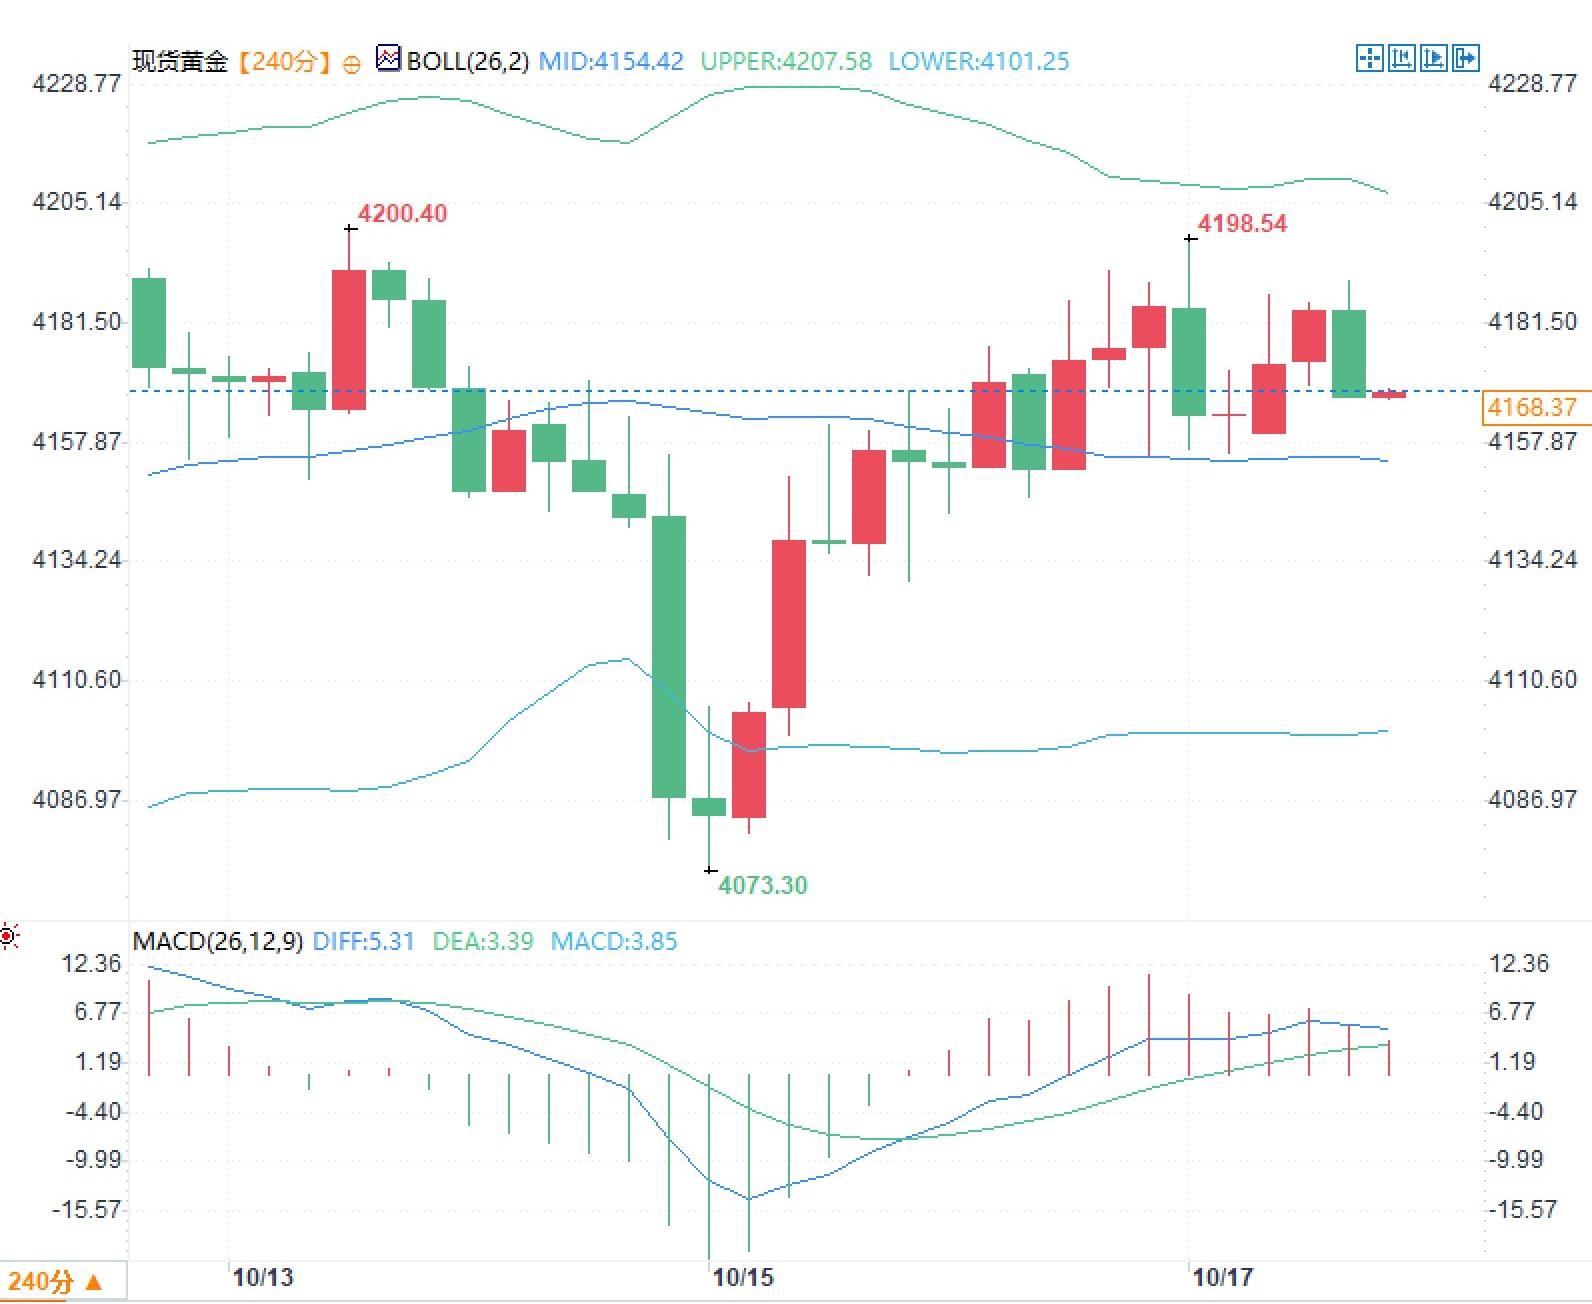
Since the outbreak of conflict in late February, disruptions to Middle Eastern energy transport routes have led to a rapid rise in crude oil prices and fueled inflation expectations. Major central banks subsequently adjusted their policy stances, and rising borrowing costs put pressure on non-interest-bearing assets. Recently, Brent crude oil has retreated slightly from its high of around $110, with signs of supply recovery coinciding with localized escalations of conflict. Spot gold has seen a slight rebound during this period, having rebounded after dipping to around $4073 last week, with its latest trading focus returning to the $4170 level. This inverse relationship reflects the interaction between inflation transmission and real interest rate expectations: the decline in crude oil prices helps alleviate short-term inflationary pressures, reducing the market's sense of urgency for further interest rate hikes, thereby easing pressure on gold. However, the ongoing conflict could change supply expectations at any time, and the linkage between the energy market and precious metals remains driven by real-time data, rather than a fixed pattern.Federal Reserve Policy Path and Market Pricing
The Federal Reserve raised its target range for the federal funds rate to 3.75% to 4% in September, emphasizing price stability as a priority. The U.S. Consumer Price Index (CPI) rose 3.7% year-on-year in September, higher than the previous reading, indicating that inflation remains above the 2% target. Chairman Kevin Warsh recently stated publicly that the central bank does not prejudge the outcome of its meetings; decisions will be based on a comprehensive assessment of output, employment, and inflation data, and the central bank refuses to provide traditional forward guidance. Consequently, the market has lowered the probability of a rate hike at the October meeting from its previous high to approximately 15%, while pricing in further action in December remains high. Warsh also mentioned that AI-related investments may boost demand for some commodities in the short term, and in the long term, may have different impacts through productivity improvements, but the transmission to employment still needs to be observed. Policy uncertainty itself provides short-term support for gold, as the market focuses more on actual data than verbal signals.US Treasury yields and continued inflows into ETFs
US Treasury yields have recently declined. Lower nominal yields have eased opportunity cost pressures on gold. Meanwhile, gold-backed ETFs have recorded net inflows for 13 consecutive weeks, with global holdings rising to a record high of approximately 4,256 tons, marking a new peak in inflows in the third quarter. This continued allocation, occurring against the backdrop of gold prices remaining below their January highs, indicates that institutional and individual investors' demand for gold as a portfolio diversification tool remains stable. The synchronized buying of bonds and gold reflects a coordinated market response to the path of real interest rates and macroeconomic fluctuations, rather than an isolated movement in a single asset.Four-hour cycle technical structure observation
Observing the four-hour chart, spot gold recently experienced a rapid correction from above $4200 to around $4073, followed by a rebound and consolidation around $4170. The Bollinger Band middle line is around $4154, the upper line is around $4207, and the lower line is around $4101. The price is currently trading above the middle line. The MACD indicator shows that the DIFF is around 5.31, the DEA is around 3.39, and the histogram value is around 3.85, all above the zero line but with a slowing slope. The overall structure shows that the bulls and bears are repeatedly testing the middle line, and neither trading volume nor indicator changes have formed a clear signal of a one-sided continuation. The market is still digesting fundamental data and policy expectations.Frequently Asked Questions
Why have spot gold and crude oil exhibited inverse fluctuations against the backdrop of recent conflicts? A: Initially, disruptions to energy supplies due to the conflict pushed up oil prices and inflation expectations, prompting central banks to tighten policies. Higher borrowing costs put pressure on non-interest-bearing gold. The subsequent decline in oil prices eased this chain reaction, reducing the market's urgency for interest rate hikes and providing temporary support for gold. How did Kevin Warsh's statements affect market pricing in the Fed's October meeting? A: Warsh clearly stated that he would not prejudge the meeting's outcome and would base decisions on subsequent data. Based on this, the market lowered the probability of an interest rate hike to about 15%, while maintaining its focus on actions at a later time. Policy uncertainty itself became a pricing variable. What allocation logic does the continuous inflow into gold-backed ETFs reflect? A: Against the backdrop of an overall gold price correction, investors continued to increase their ETF holdings, with global holdings rising to record levels. This reflects the use of gold as a combined tool to hedge against inflation expectations and real interest rate fluctuations, rather than simply chasing price increases.- Risk Warning and Disclaimer
- The market involves risk, and trading may not be suitable for all investors. This article is for reference only and does not constitute personal investment advice, nor does it take into account certain users’ specific investment objectives, financial situation, or other needs. Any investment decisions made based on this information are at your own risk.