The gold sell-off has temporarily subsided; can the bulls reverse the trend?
2026-10-20 01:50:20
Gold's breakout in August has reversed, with prices coming under pressure. However, similar to the trend in June and July this year, gold prices have found strong support at key psychological levels: the $4,000 level formed a bottom this summer, and in the past two weeks, the $4,100 level has become a new support level.  The short-term and long-term trends of gold often diverge significantly, as clearly demonstrated in the gold market in 2026. At the beginning of the year, gold prices surged, reaching a severely overbought state. After a sharp reversal in January, gold prices rebounded, continuing their upward trend until March. Subsequently, the situation in Iran dominated headlines, inflation concerns intensified, and gold bears began to dominate the market. The June FOMC interest rate decision, with the Fed releasing a hawkish signal, further weakened investors' willingness to go long on gold. A hawkish monetary policy coupled with rebounding inflation made holding non-interest-bearing assets like gold no longer an ideal choice. Following Kevin Warsh's first interest rate meeting as Fed director, gold prices immediately fell, retesting the $4,000 level. However, subsequent price action warrants attention: bears repeatedly attempted to break through this level but failed. The weekly chart shows that spot gold did not close below this psychological level for any week, indicating that some market participants took advantage of short-term negative news to buy on dips.
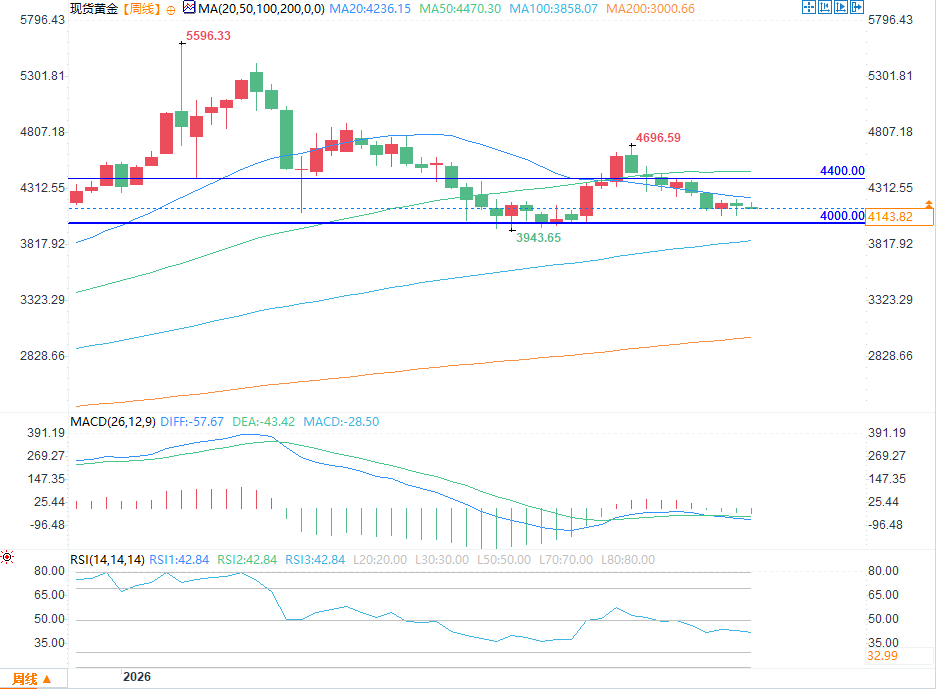 (Gold Weekly Chart) On the weekly chart, gold prices first found support at $4,000, then rebounded, and recently found support again at $4,100, showing a relatively smooth trend. However, the daily chart shows more volatile fluctuations, with the current market trend somewhat similar to that of June and July. Essentially, gold prices are currently in a range-bound pattern, but the stability of this range does not meet the ideal standards for range trading. Gold prices have encountered resistance at $4,200 multiple times, and the upper shadow of the candlestick indicates that short sellers will use the rebound to reduce their short positions. However, as in June and July, gold prices leave lower shadows when testing lower lows, as was the case last week: the bears failed to break through the previous week's low and form a higher low pattern.
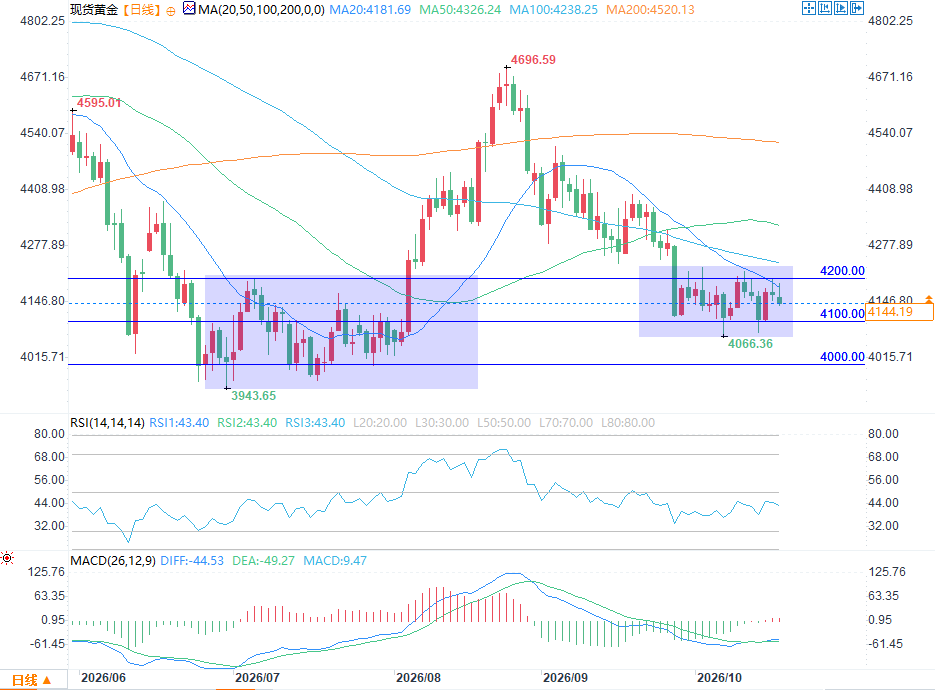 (Gold Daily Chart) At this stage, traders should develop a clear trading plan before betting on a one-sided rise or fall in gold prices. Long-term perspective: If gold prices hold the short-term support level and continue the long-term upward trend, it still presents an opportunity to buy. Short-term perspective: Traders can sell short on rallies within the range; once the support is broken, gold prices may fall back to test $4000 again. The 4-hour chart below marks the trading range formed in recent weeks. Support above $4074 is worth noting, and the $4109-$4120 range also has a support effect. On the resistance side, the battle between bulls and bears is fierce around $4200, and a secondary resistance level has formed around $4190, which can be used as a resistance dividing line.
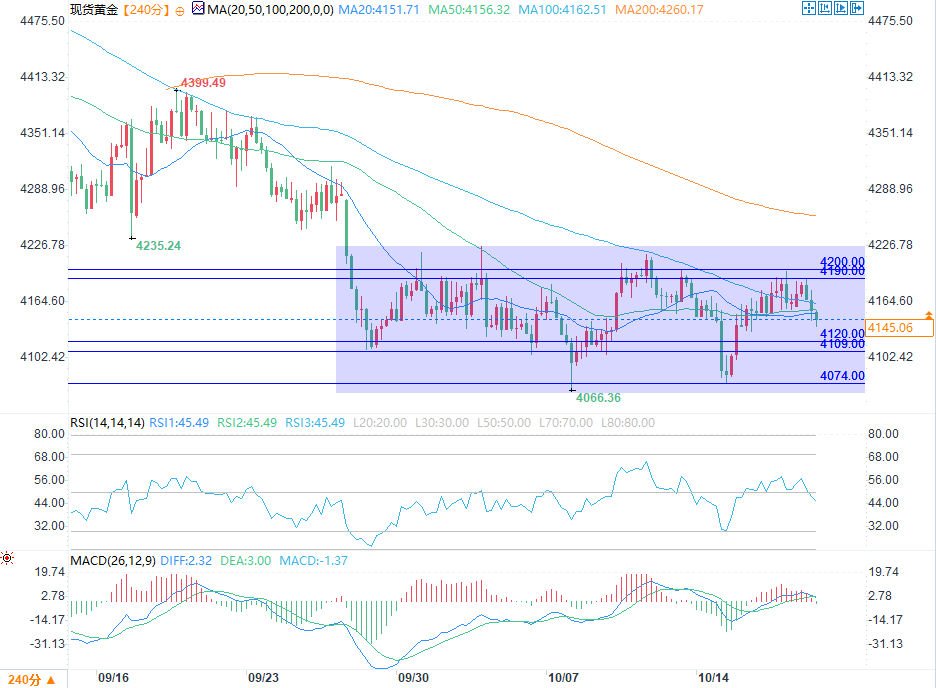 (Gold 4-hour chart)
The short-term and long-term trends of gold often diverge significantly, as clearly demonstrated in the gold market in 2026. At the beginning of the year, gold prices surged, reaching a severely overbought state. After a sharp reversal in January, gold prices rebounded, continuing their upward trend until March. Subsequently, the situation in Iran dominated headlines, inflation concerns intensified, and gold bears began to dominate the market. The June FOMC interest rate decision, with the Fed releasing a hawkish signal, further weakened investors' willingness to go long on gold. A hawkish monetary policy coupled with rebounding inflation made holding non-interest-bearing assets like gold no longer an ideal choice. Following Kevin Warsh's first interest rate meeting as Fed director, gold prices immediately fell, retesting the $4,000 level. However, subsequent price action warrants attention: bears repeatedly attempted to break through this level but failed. The weekly chart shows that spot gold did not close below this psychological level for any week, indicating that some market participants took advantage of short-term negative news to buy on dips. (Gold Weekly Chart) On the weekly chart, gold prices first found support at $4,000, then rebounded, and recently found support again at $4,100, showing a relatively smooth trend. However, the daily chart shows more volatile fluctuations, with the current market trend somewhat similar to that of June and July. Essentially, gold prices are currently in a range-bound pattern, but the stability of this range does not meet the ideal standards for range trading. Gold prices have encountered resistance at $4,200 multiple times, and the upper shadow of the candlestick indicates that short sellers will use the rebound to reduce their short positions. However, as in June and July, gold prices leave lower shadows when testing lower lows, as was the case last week: the bears failed to break through the previous week's low and form a higher low pattern. (Gold Daily Chart) At this stage, traders should develop a clear trading plan before betting on a one-sided rise or fall in gold prices. Long-term perspective: If gold prices hold the short-term support level and continue the long-term upward trend, it still presents an opportunity to buy. Short-term perspective: Traders can sell short on rallies within the range; once the support is broken, gold prices may fall back to test $4000 again. The 4-hour chart below marks the trading range formed in recent weeks. Support above $4074 is worth noting, and the $4109-$4120 range also has a support effect. On the resistance side, the battle between bulls and bears is fierce around $4200, and a secondary resistance level has formed around $4190, which can be used as a resistance dividing line. (Gold 4-hour chart)- Risk Warning and Disclaimer
- The market involves risk, and trading may not be suitable for all investors. This article is for reference only and does not constitute personal investment advice, nor does it take into account certain users’ specific investment objectives, financial situation, or other needs. Any investment decisions made based on this information are at your own risk.