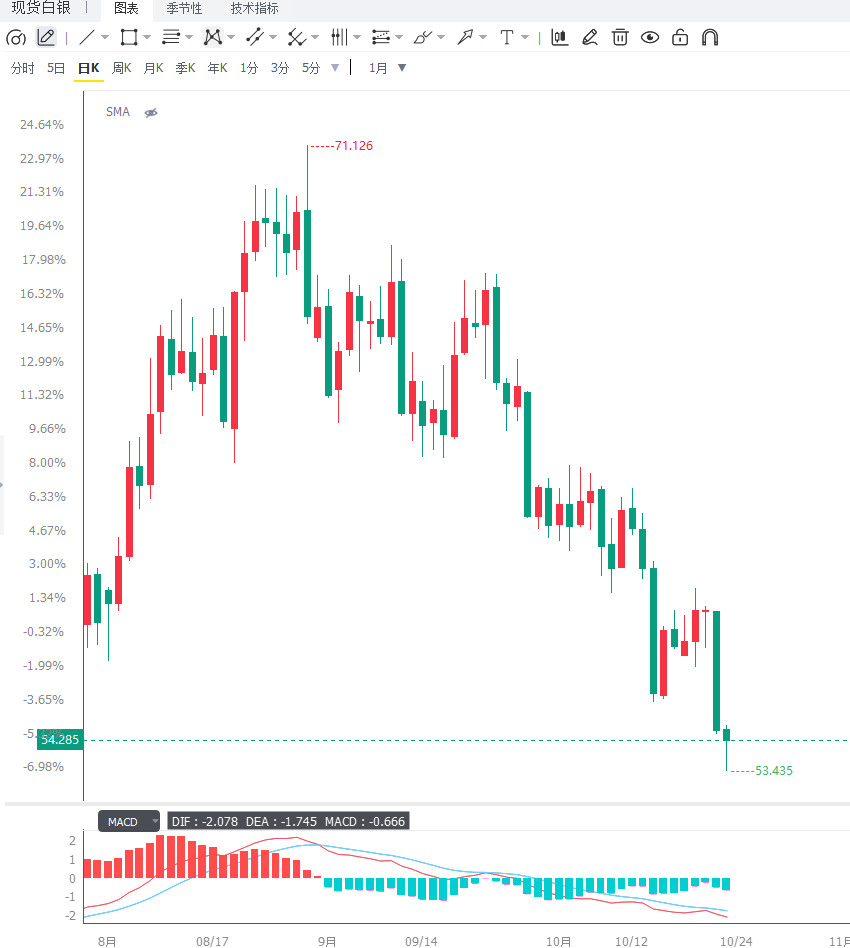
Silver fell below $54, hitting a new low since November 2025. Be wary of a short-term oversold rebound.
2026-10-23 14:22:22
On Friday during the Asian session, spot silver traded around $54.00, continuing its nearly two-month downtrend, and accelerating its decline in early Asian trading. The core contradiction in silver prices currently lies in the fact that negative factors from the fundamentals and monetary front have not yet dissipated, while oversold technical signals have begun to accumulate – giving silver a characteristic of "falling sharply but hesitantly," similar to the logic behind gold's simultaneous weakening during this round of geopolitical escalation, but with more dramatic fluctuations.  From the perspective of suppressing factors, the interest rate environment remains a common headwind for precious metals. The Federal Reserve implemented its first interest rate hike since 2023 last month, and Chairman Warsh avoided providing guidance on the timing and necessity of future rate hikes last week, but emphasized that higher-than-expected inflation has not changed his assessment of the US economy. According to the CME Group's FedWatch tool, the market is pricing in a 92.8% probability that interest rates will remain unchanged at the October meeting, and the year-end tightening path has not been disproven. Higher interest rates increase the holding cost of non-interest-bearing assets, which often has a more direct impact on silver than on gold: gold still has the structural support of central bank gold purchases and ETF holdings, while silver has weaker financial attributes and a heavier speculative position, making it more susceptible to algorithmic selling and concentrated liquidation of leveraged long positions in an environment of rising interest rates. This is the fundamental reason why silver prices have fallen more sharply than gold prices in this round, and why the rebound lacks support. Silver's industrial attributes have amplified its two-way volatility in this round of market movements. On the one hand, high oil prices have pushed up global inflation and production costs, theoretically providing cost support for industrial metals. On the other hand, rising freight and insurance costs caused by shipping disruptions in the Middle East are exacerbating concerns about global trade and manufacturing demand. When "cost-push" factors meet "demand concerns," silver often prices itself as a risk asset—the logic of funds withdrawing from high-risk exposures and shifting to safe-haven government bonds simultaneously drains speculative buying of silver. This dual identity makes it difficult for silver to replicate gold's safe-haven performance during periods of geopolitical tension; instead, it is more likely to decline in tandem with industrial metals such as copper. It is inappropriate to simply equate geopolitical escalation with a bullish outlook for silver; this misjudgment is the main reason for the repeated setbacks of the bulls in this round. From the perspective of cross-asset correlation, the current fluctuations in silver are essentially a superposition of four factors: first, the proactive suppression exerted by the high-interest-rate environment through the cost of holding; second, the offsetting effect of cost support and demand concerns brought about by high oil price fluctuations; third, the diversion effect of safe-haven funds flowing to the Japanese yen, Swiss franc, and government bonds rather than precious metals; and fourth, the self-reinforcing effect of programmed selling triggered by technical breakdowns. It is worth noting that the gold-silver ratio has passively risen during this round of decline—when gold holds above $4,000 while silver falls below $54, it indicates that the market's pricing focus remains on interest rates rather than inflation. The trend of this ratio can serve as supplementary evidence for judging whether it is "expectation-driven or actual shortage": if the gold-silver ratio continues to climb, it indicates that the industrial attributes of silver are still dragging down its performance; if the ratio begins to fall, it may indicate that funds are overflowing from gold to silver, and the rebound elasticity at that time will be significantly greater than that of gold. On the daily chart, spot silver is running below the 200-day simple moving average. It failed to break through $58.00 (38.2% Fibonacci retracement level) twice this week. The MACD is -0.34 and below the zero axis, and the medium-term bearish structure has not been repaired. The RSI (14) is 31.53, close to the oversold boundary, indicating that the downward momentum is dominant but may be close to exhaustion. It is a typical "bearish trend and oversold indicator" pattern. It is advisable to wait for confirmation signals rather than blindly shorting. The immediate resistance level is defined by the $55.50 area, followed by $58.00, the psychological level of $60.00, the dense area of $61.50-$61.55, and the 23.6% Fibonacci retracement level of approximately $63.00. Only a decisive break above $63.00 on the daily chart can alleviate this resistance. On the downside, the first support level is the previous low of $53.50, followed by $52.80 and the psychological level of $52.00. $54.00 is a key recent level; a decisive break and close below it will open up potential for further declines towards $52.80 or even lower. On the 4-hour chart, silver prices have retreated from near $55.00 and are slowly moving downwards along the short-term moving averages. The MACD histogram is expanding below the zero line, and the fast and slow lines are diverging downwards, indicating that short-term bears are in control.
 Editor's Summary: The core contradiction for silver in the short term lies in the continued pressure from high interest rates and technical breakdowns. However, the oversold RSI and the support at the $54.00 level provide a buffer. This dual-pronged approach makes silver prices more likely to consolidate within the $53.50-$55.50 range, awaiting confirmation of a breakout. Going forward, three key variables need to be monitored: first, the direction of the US dollar index and the real yield on US Treasury bonds, which are core indicators for precious metal pricing; second, the situation of the Strait of Hormuz and oil price trends, as the dual transmission of costs and demand will determine the pricing direction of silver's industrial attributes; and third, the divergence between the Fed's year-end policy path and the gold-silver ratio, the latter serving as a supplementary indicator of whether funds are flowing from gold to silver.
From the perspective of suppressing factors, the interest rate environment remains a common headwind for precious metals. The Federal Reserve implemented its first interest rate hike since 2023 last month, and Chairman Warsh avoided providing guidance on the timing and necessity of future rate hikes last week, but emphasized that higher-than-expected inflation has not changed his assessment of the US economy. According to the CME Group's FedWatch tool, the market is pricing in a 92.8% probability that interest rates will remain unchanged at the October meeting, and the year-end tightening path has not been disproven. Higher interest rates increase the holding cost of non-interest-bearing assets, which often has a more direct impact on silver than on gold: gold still has the structural support of central bank gold purchases and ETF holdings, while silver has weaker financial attributes and a heavier speculative position, making it more susceptible to algorithmic selling and concentrated liquidation of leveraged long positions in an environment of rising interest rates. This is the fundamental reason why silver prices have fallen more sharply than gold prices in this round, and why the rebound lacks support. Silver's industrial attributes have amplified its two-way volatility in this round of market movements. On the one hand, high oil prices have pushed up global inflation and production costs, theoretically providing cost support for industrial metals. On the other hand, rising freight and insurance costs caused by shipping disruptions in the Middle East are exacerbating concerns about global trade and manufacturing demand. When "cost-push" factors meet "demand concerns," silver often prices itself as a risk asset—the logic of funds withdrawing from high-risk exposures and shifting to safe-haven government bonds simultaneously drains speculative buying of silver. This dual identity makes it difficult for silver to replicate gold's safe-haven performance during periods of geopolitical tension; instead, it is more likely to decline in tandem with industrial metals such as copper. It is inappropriate to simply equate geopolitical escalation with a bullish outlook for silver; this misjudgment is the main reason for the repeated setbacks of the bulls in this round. From the perspective of cross-asset correlation, the current fluctuations in silver are essentially a superposition of four factors: first, the proactive suppression exerted by the high-interest-rate environment through the cost of holding; second, the offsetting effect of cost support and demand concerns brought about by high oil price fluctuations; third, the diversion effect of safe-haven funds flowing to the Japanese yen, Swiss franc, and government bonds rather than precious metals; and fourth, the self-reinforcing effect of programmed selling triggered by technical breakdowns. It is worth noting that the gold-silver ratio has passively risen during this round of decline—when gold holds above $4,000 while silver falls below $54, it indicates that the market's pricing focus remains on interest rates rather than inflation. The trend of this ratio can serve as supplementary evidence for judging whether it is "expectation-driven or actual shortage": if the gold-silver ratio continues to climb, it indicates that the industrial attributes of silver are still dragging down its performance; if the ratio begins to fall, it may indicate that funds are overflowing from gold to silver, and the rebound elasticity at that time will be significantly greater than that of gold. On the daily chart, spot silver is running below the 200-day simple moving average. It failed to break through $58.00 (38.2% Fibonacci retracement level) twice this week. The MACD is -0.34 and below the zero axis, and the medium-term bearish structure has not been repaired. The RSI (14) is 31.53, close to the oversold boundary, indicating that the downward momentum is dominant but may be close to exhaustion. It is a typical "bearish trend and oversold indicator" pattern. It is advisable to wait for confirmation signals rather than blindly shorting. The immediate resistance level is defined by the $55.50 area, followed by $58.00, the psychological level of $60.00, the dense area of $61.50-$61.55, and the 23.6% Fibonacci retracement level of approximately $63.00. Only a decisive break above $63.00 on the daily chart can alleviate this resistance. On the downside, the first support level is the previous low of $53.50, followed by $52.80 and the psychological level of $52.00. $54.00 is a key recent level; a decisive break and close below it will open up potential for further declines towards $52.80 or even lower. On the 4-hour chart, silver prices have retreated from near $55.00 and are slowly moving downwards along the short-term moving averages. The MACD histogram is expanding below the zero line, and the fast and slow lines are diverging downwards, indicating that short-term bears are in control. Editor's Summary: The core contradiction for silver in the short term lies in the continued pressure from high interest rates and technical breakdowns. However, the oversold RSI and the support at the $54.00 level provide a buffer. This dual-pronged approach makes silver prices more likely to consolidate within the $53.50-$55.50 range, awaiting confirmation of a breakout. Going forward, three key variables need to be monitored: first, the direction of the US dollar index and the real yield on US Treasury bonds, which are core indicators for precious metal pricing; second, the situation of the Strait of Hormuz and oil price trends, as the dual transmission of costs and demand will determine the pricing direction of silver's industrial attributes; and third, the divergence between the Fed's year-end policy path and the gold-silver ratio, the latter serving as a supplementary indicator of whether funds are flowing from gold to silver.
- Risk Warning and Disclaimer
- The market involves risk, and trading may not be suitable for all investors. This article is for reference only and does not constitute personal investment advice, nor does it take into account certain users’ specific investment objectives, financial situation, or other needs. Any investment decisions made based on this information are at your own risk.