Gold staged a sharp V-shaped recovery: How will the market unfold amid liquidity crunch?
2026-10-23 18:10:21
On Friday (October 23), spot gold experienced a significant rebound after hitting a low during the Asian and European sessions, following a sharp drop of about 3% in the New York session of the previous trading day. As mentioned in previous articles, the decline in US stocks would lead to a passive tightening of global liquidity, causing gold prices to fall along with risk assets. The market performance over the past two days has fully confirmed this judgment. Spot gold weakened in tandem with US tech stocks, with gold prices briefly falling below the $4,000 mark, marking a weekly decline of over 3.5%, the largest weekly drop in four months. Subsequently, with A-share optical module companies collectively announcing buyback benefits, gold prices rebounded along with A-share tech stocks. In other words, when the stock market undergoes a sharp de-risking process, the VIX rises, and VaR risk control constraints tighten, gold will transform from a traditional safe-haven asset into a liquid backup asset, falling in tandem with equities. This is a classic liquidity stampede scenario, but it does not mean that gold's safe-haven function has permanently failed. The current main theme: oil prices are pushing up inflation, and the Fed's high interest rate expectations continue to suppress gold prices. The primary trading narrative in the market right now remains that energy inflation constrains monetary policy. While the core issue of diesel shortages has shown some marginal easing, and the Russia-Ukraine negotiations have seen a turning point, somewhat mitigating the supply gap, shipping costs and marine insurance costs remain high. The rigidity of logistics costs is difficult to resolve, and inflation lacks a basis for a rapid decline. Consequently, the Federal Reserve has no room to shift towards easing, and the window for interest rate cuts continues to be pushed back. Shipping risks in the Strait of Hormuz could escalate again at any time, and Iran's offshore crude oil reserves in Singapore and Malaysia are nearing depletion. If Middle Eastern supply disruptions recur, oil prices will surge again, fueling inflation expectations and further limiting the Fed's room for interest rate cuts. 
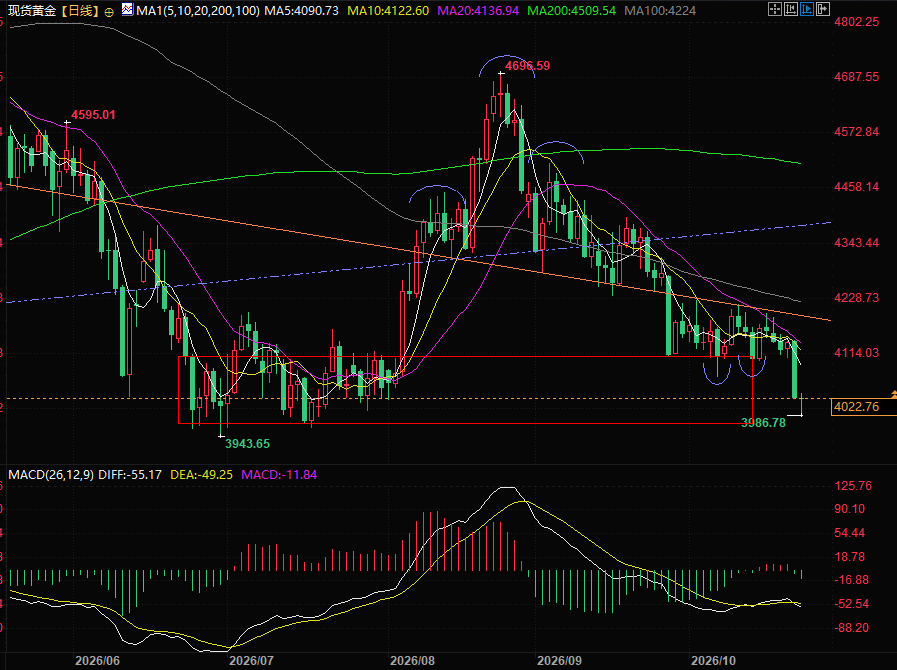 (Spot gold daily chart, source: EasyTrade) At 18:08 Beijing time, spot gold is currently trading at $4023 per ounce.
Why did US Treasury yields and gold prices fall in tandem?
One noteworthy anomaly in the market is the simultaneous weakening of gold prices alongside a sharp drop in US Treasury prices. Both are traditional safe-haven assets, yet funds haven't flowed into the interest-free gold market; instead, they've continued to flow into US Treasuries, which offer stable coupon rates. In a high-interest-rate environment, gold's lack of interest income is amplified, leading to a continuously rising opportunity cost of holding it. Safe-haven funds naturally gravitate towards interest-bearing assets. Analysts point out that with the current high yield on 10-year US Treasury bonds, risk-free US Treasuries are significantly more attractive than gold. The prioritization of Treasury bonds by safe-haven funds is the underlying logic behind the recent simultaneous weakening of gold and US Treasuries . However, the short-term decline in US Treasury yields is ultimately a result of short-term safe-haven buying. The final market trend for US Treasuries will depend on two fundamental factors: the Federal Reserve's interest rate path and the state of the US economy. Only when employment weakens and inflation steadily declines will the market ignite expectations of lower interest rates, pushing US Treasury yields downwards, and allowing gold prices to experience a substantial recovery.The core driver of this sharp decline: a global liquidity crunch, making gold the preferred choice for liquidation.
Interest rate expectations are merely a superficial factor suppressing gold prices. The real driver of the accelerated decline is the liquidity crisis spreading across markets. The global sell-off in tech stocks continues, with numerous leveraged accounts facing margin calls. Among various asset classes, gold, with its ample liquidity and easy conversion to cash, has become the preferred asset for institutions to recoup cash and cover equity position shortfalls. This is the underlying reason for the nearly 12-ton reduction in holdings by global gold ETFs in a single day. The FOF team analysis indicates that gold has ample trading depth, coupled with substantial accumulated profits. When portfolios face deleveraging and margin calls, it is often the first asset institutions liquidate. Currently, the overall market liquidity is tight, and there is almost no strong buying support during a downtrend. Corporate funds are tied up in the stock market and capital expenditure projects, while household wealth is largely anchored in the real estate and equity markets. Even investors with idle funds prefer to allocate to US Treasury bonds with higher yields rather than gold. JPMorgan Chase believes that when the market enters a phase of widespread risk reduction, the lack of new funds and the fact that existing funds are locked up by various assets, coupled with a lack of new buying support, will amplify the negative feedback effect of the decline. Once risky assets begin to sell off, the pattern of indiscriminate selling is likely to continue, making it easy to understand why stocks and funds fall in tandem.There's no need to panic excessively: Short-term liquidity shocks will not change the long-term bullish trend in gold.
Bridgewater's reduction of its gold allocation and reduction of its previously overweight gold positions in September was based on the logic of persistently high US Treasury yields, a global asset benchmark. According to Bridgewater China's letter to investors in September, this reduction stemmed from rising interest rates increasing the cost of holding gold, coupled with rising oil prices squeezing disposable income in energy-importing countries like India, putting pressure on physical gold demand. This was a dynamic adjustment of positions, not a long-term bearish view on gold. We need to clearly distinguish between short-term disturbances and long-term fundamentals. Liquidity squeezes are always phased market events. Once the selling pressure in US stocks slows, the decline in gold prices moderates, and the wave of margin calls subsides, the passive selling will come to an end. As market panic gradually subsides, funds will still choose to flow back into gold. The medium- to long-term support factors such as geopolitical conflicts, continued central bank gold purchases, and the long-term weakening of the US dollar remain solid. The World Gold Council's viewpoint is quite insightful: ETF outflows represent the departure of short-term speculative funds, but central bank gold purchases are a long-term strategic allocation aimed at diversifying reserves and hedging against dollar credit risk. They are not swayed by short-term interest rate fluctuations or liquidity disturbances, and are the most important supporting force during periods of declining gold prices. There are already significant disagreements within the market. Short-selling institutions like Gundlach of DoubleLine Capital maintain their judgment that with the high-interest-rate cycle continuing, the downward pressure on gold is unlikely to reverse, and further declines cannot be ruled out. This point also needs to be objectively considered.Summary and Technical Analysis:
Before liquidity pressures ease, priority should be given to observing when the selling pressure in US stocks subsides and when the passive selling in gold clears up. Blindly entering the market to buy the dip is not advisable. Short-term trading should focus on changes in liquidity, closely monitoring US stock market trends and ETF fund flows. The turning point for the medium-term market lies in inflation and employment data; the performance of PCE and non-farm payrolls will determine whether high interest rate expectations will ease. Only when inflation and labor data weaken significantly and interest rate expectations shift can gold potentially open up room for medium-term recovery. Looking at the longer term, Middle Eastern oil supply and the US-Iran geopolitical situation remain the most important variables; geopolitical risks are always an undeniable driver of gold price increases. Currently, gold is facing a double squeeze from liquidity liquidation and high interest rate expectations, making it difficult to change its weak price pattern in the short term. However, this is merely a temporary disturbance. Once the liquidity crunch subsides, gold will return to its pricing trajectory as a safe haven and inflation hedge, and there is no need to be overly bearish. Technical Analysis: Spot gold broke below its previous trading range and entered a lower moving average range. Currently, the overall moving averages are in a bearish alignment, indicating a clear downward trend. It is currently supported by the bottom of the trading range, which is also a previous area of dense trading. We should observe whether the downward trend can be alleviated and turn into range-bound trading. (Spot gold daily chart, source: EasyTrade) At 18:08 Beijing time, spot gold is currently trading at $4023 per ounce.
- Risk Warning and Disclaimer
- The market involves risk, and trading may not be suitable for all investors. This article is for reference only and does not constitute personal investment advice, nor does it take into account certain users’ specific investment objectives, financial situation, or other needs. Any investment decisions made based on this information are at your own risk.