Gold prices are testing the $4,000 support level; is a deep correction on the horizon?
2026-10-26 18:12:22
On Monday (October 26) during the European session, gold prices were in a rather passive position at the start of the week, repeatedly testing the possibility of breaking below the $4,000 mark. From a technical perspective, this level is crucial for the bulls to hold onto hope and stage a rebound at the end of October.  Despite persistent geopolitical risks and a recent decline in US Treasury yields, gold has failed to gain strong upward momentum. The rebound of August and September has completely subsided, with the price chart showing a pattern of lower highs and lower lows, indicating that bears are gradually gaining control. Currently, the $4,000 level is holding, and gold is trading around $4,016. It's too early to determine if a definitive technical breakout has occurred. However, the repeated testing of this important support level without a strong rebound signals a less than optimistic outlook.
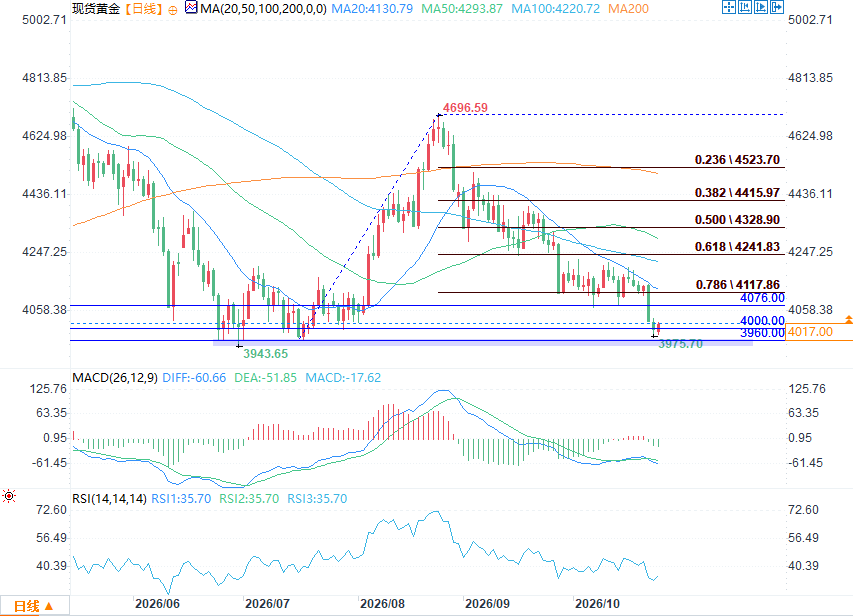 (Spot gold daily chart source: FX678) Below $4,000, the previous lows in the $3,942-$3,960 range will form a second line of support. However, if the gold price effectively breaks below the $4,000 psychological level, especially if the daily close is below this level, it will likely trigger further downward momentum in precious metals. At that time, the gold price may begin a deep correction, targeting the 100-week moving average, currently located around $3,870. This is a very significant technical level: gold has not tested the 100-week moving average since October 2023. In addition, this level is also close to the lows of October-November 2025. Therefore, if selling pressure continues to intensify, this area is likely to be a key battleground for the bulls to regroup and resist the decline. In the short term, the primary task for the bulls is to hold above $4,000 to drive a definite rebound in the gold price. The first resistance levels are the 100-hour and 200-hour moving averages, located at $4076 and $4114 respectively. Only if gold prices stabilize above $4117 and then further challenge the more difficult $4200 level would it be a positive signal that the downward momentum has eased. Until then, the risk appetite remains skewed towards the downside. The only positive factor for the bulls at present is that the market has not yet truly broken down. The $4000 level is the watershed; holding this level indicates a slightly weak market with potential for a rebound; a breach of this level would confirm the downtrend. Subsequent price movements depend entirely on whether the bulls can hold this key psychological level.
Despite persistent geopolitical risks and a recent decline in US Treasury yields, gold has failed to gain strong upward momentum. The rebound of August and September has completely subsided, with the price chart showing a pattern of lower highs and lower lows, indicating that bears are gradually gaining control. Currently, the $4,000 level is holding, and gold is trading around $4,016. It's too early to determine if a definitive technical breakout has occurred. However, the repeated testing of this important support level without a strong rebound signals a less than optimistic outlook. (Spot gold daily chart source: FX678) Below $4,000, the previous lows in the $3,942-$3,960 range will form a second line of support. However, if the gold price effectively breaks below the $4,000 psychological level, especially if the daily close is below this level, it will likely trigger further downward momentum in precious metals. At that time, the gold price may begin a deep correction, targeting the 100-week moving average, currently located around $3,870. This is a very significant technical level: gold has not tested the 100-week moving average since October 2023. In addition, this level is also close to the lows of October-November 2025. Therefore, if selling pressure continues to intensify, this area is likely to be a key battleground for the bulls to regroup and resist the decline. In the short term, the primary task for the bulls is to hold above $4,000 to drive a definite rebound in the gold price. The first resistance levels are the 100-hour and 200-hour moving averages, located at $4076 and $4114 respectively. Only if gold prices stabilize above $4117 and then further challenge the more difficult $4200 level would it be a positive signal that the downward momentum has eased. Until then, the risk appetite remains skewed towards the downside. The only positive factor for the bulls at present is that the market has not yet truly broken down. The $4000 level is the watershed; holding this level indicates a slightly weak market with potential for a rebound; a breach of this level would confirm the downtrend. Subsequent price movements depend entirely on whether the bulls can hold this key psychological level.- Risk Warning and Disclaimer
- The market involves risk, and trading may not be suitable for all investors. This article is for reference only and does not constitute personal investment advice, nor does it take into account certain users’ specific investment objectives, financial situation, or other needs. Any investment decisions made based on this information are at your own risk.