Following the attack on Saudi oil refineries, WTI crude oil rose above $101.50.
2026-10-28 19:22:24
On Wednesday (October 28) during the European session, WTI crude oil prices climbed to $101.71, a gain of 1.81%. The Houthi rebels in Yemen claimed to have used missiles to attack Saudi Arabia's Rastanura oil refinery. The American Petroleum Institute (API) reported that crude oil inventories decreased by 2.031 million barrels in the week ending October 23.  On Wednesday (October 28) during the early European session, West Texas Intermediate (WTI) crude oil, the benchmark for US crude, traded around $100.75. An attack on a Saudi refinery reignited market concerns about supply risks from the major oil exporter, pushing WTI prices higher. Reports indicated that the Houthi rebels in Yemen, allied with Iran, launched a ballistic missile at the Rastanura refinery in eastern Saudi Arabia on Tuesday. This refinery is Saudi Arabia's largest. ING commodity strategists stated that the market is currently pricing in a significant possibility of further escalation of the conflict. The strategists added, "Oil prices remain high as the market awaits clearer signals from President Trump regarding his next move against Iran." US crude oil inventories declined last week. According to data from the American Petroleum Institute (API), crude oil inventories fell by 2.031 million barrels in the week ending October 23, compared to a 4.93 million barrel decrease the previous week. Traders are awaiting the U.S. Energy Information Administration's (EIA) crude oil inventory report, due later on Wednesday. A larger-than-expected drop in crude oil inventories would indicate strong demand and could push WTI oil prices higher; conversely, a larger-than-expected increase would suggest weak demand or oversupply, potentially putting downward pressure on WTI oil prices. Technical Analysis
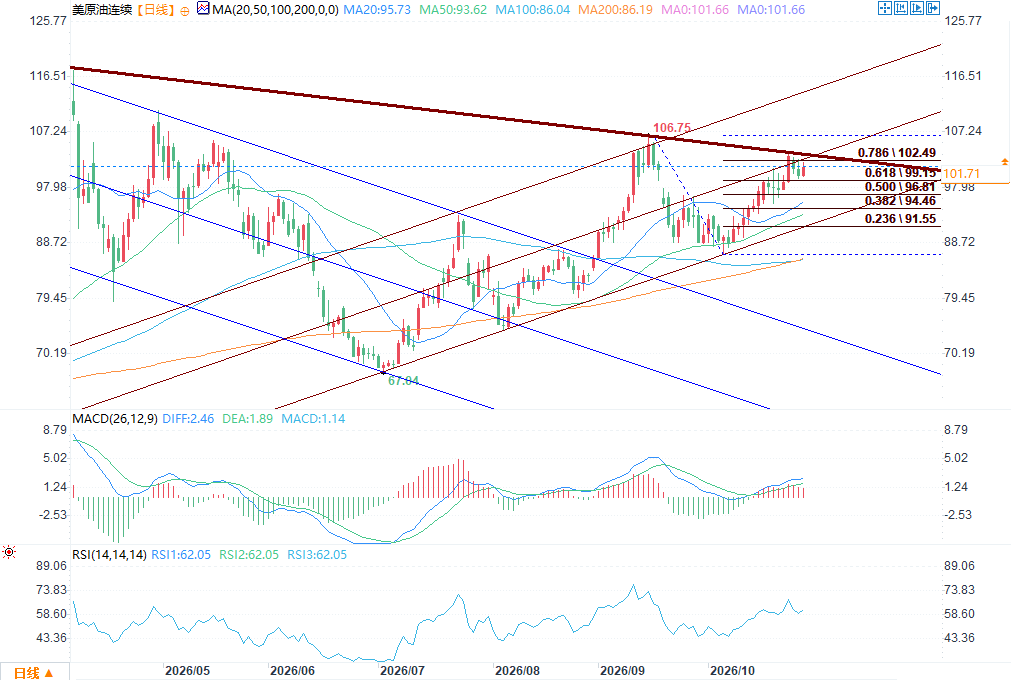 (WTI Crude Oil Daily Chart Source: EasyForex) US crude oil is currently in a high-level consolidation phase within a medium-term rebound structure. This upward trend, which started from the low of 67.04, has been supported by a rising red channel, with prices consistently above the 20-day and 50-day moving averages. The bullish alignment of these moving averages provides support for the medium-term bullish pattern. However, the price encountered resistance at the 106.75 high from a long-term downtrend line, a medium-to-long-term resistance zone since 116.51. After the initial surge, the price failed to continue its upward momentum and instead entered a consolidation phase, with the pace of the rise noticeably slowing. The trend has shifted from a one-sided upward movement to a consolidation and accumulation mode. From a Fibonacci retracement perspective, the current price of 101.71 is close to the 0.786 Fibonacci retracement level of this upward wave at 102.49, which is the most direct short-term resistance level. This set of Fibonacci retracement levels forms a clear range hierarchy: whether the 102.49 level can be effectively broken is a leading signal for whether the bulls can mount a second push in the short term; the 0.618 level at 99.15 is the core short-term defense level, and once it is effectively broken, the center of gravity of the oscillation will shift downward, and the price will likely fall back to the 0.5 retracement level near 96.81 and the support of the 20-day moving average. These retracement levels divide the current oscillation range into strong and weak gradients, which are key references for determining the next move. In this oscillating pattern, the accompanying indicators show signs of weakening bullish momentum. The MACD maintains that the DIFF is above the DEA, and the red bars are still positive, indicating that the underlying bullish structure has not been broken, but the red bars are continuously narrowing, indicating that the upward momentum is gradually weakening and lacking a signal for a new round of volume-driven upward movement. The RSI is in a neutral-to-strong range around 62, neither entering the overbought zone above 70 nor falling below the 50 support/resistance level, confirming the current balanced state of the bulls and bears. The probability of a short-term one-sided trend is low; back-and-forth movement is the main characteristic. The subsequent market movement can be observed under two core scenarios. A bullish path requires the price to hold the 99.15 support level and close above 102.49 to have a chance to challenge the strong resistance level of 106.75 again. Only by breaking through this trendline resistance can greater upward potential be opened. Conversely, if the price continues to be under pressure and effectively breaks below 99.15, it means that the short-term bullish consolidation has turned into a deep correction, and the market will test the strong support level of 96.81. If this level is also breached, the upward channel structure that has lasted for several months will be impacted, and the medium-term trend logic needs to be reassessed. Finally, it should be noted that the fundamentals of crude oil are highly volatile; geopolitical news, OPEC+ policies, and inventory data could all quickly disrupt the current technical consolidation structure. This daily technical analysis only reflects the strength of bulls and bears on the price chart itself and should not be used as the sole basis for trading. During directional breakouts, the weight given to one-sided predictions should be reduced; instead, prioritize signals from breakouts or breakdowns of key support and resistance levels. Wait for the market to establish a clear direction before applying any corresponding trading strategy.
On Wednesday (October 28) during the early European session, West Texas Intermediate (WTI) crude oil, the benchmark for US crude, traded around $100.75. An attack on a Saudi refinery reignited market concerns about supply risks from the major oil exporter, pushing WTI prices higher. Reports indicated that the Houthi rebels in Yemen, allied with Iran, launched a ballistic missile at the Rastanura refinery in eastern Saudi Arabia on Tuesday. This refinery is Saudi Arabia's largest. ING commodity strategists stated that the market is currently pricing in a significant possibility of further escalation of the conflict. The strategists added, "Oil prices remain high as the market awaits clearer signals from President Trump regarding his next move against Iran." US crude oil inventories declined last week. According to data from the American Petroleum Institute (API), crude oil inventories fell by 2.031 million barrels in the week ending October 23, compared to a 4.93 million barrel decrease the previous week. Traders are awaiting the U.S. Energy Information Administration's (EIA) crude oil inventory report, due later on Wednesday. A larger-than-expected drop in crude oil inventories would indicate strong demand and could push WTI oil prices higher; conversely, a larger-than-expected increase would suggest weak demand or oversupply, potentially putting downward pressure on WTI oil prices. Technical Analysis (WTI Crude Oil Daily Chart Source: EasyForex) US crude oil is currently in a high-level consolidation phase within a medium-term rebound structure. This upward trend, which started from the low of 67.04, has been supported by a rising red channel, with prices consistently above the 20-day and 50-day moving averages. The bullish alignment of these moving averages provides support for the medium-term bullish pattern. However, the price encountered resistance at the 106.75 high from a long-term downtrend line, a medium-to-long-term resistance zone since 116.51. After the initial surge, the price failed to continue its upward momentum and instead entered a consolidation phase, with the pace of the rise noticeably slowing. The trend has shifted from a one-sided upward movement to a consolidation and accumulation mode. From a Fibonacci retracement perspective, the current price of 101.71 is close to the 0.786 Fibonacci retracement level of this upward wave at 102.49, which is the most direct short-term resistance level. This set of Fibonacci retracement levels forms a clear range hierarchy: whether the 102.49 level can be effectively broken is a leading signal for whether the bulls can mount a second push in the short term; the 0.618 level at 99.15 is the core short-term defense level, and once it is effectively broken, the center of gravity of the oscillation will shift downward, and the price will likely fall back to the 0.5 retracement level near 96.81 and the support of the 20-day moving average. These retracement levels divide the current oscillation range into strong and weak gradients, which are key references for determining the next move. In this oscillating pattern, the accompanying indicators show signs of weakening bullish momentum. The MACD maintains that the DIFF is above the DEA, and the red bars are still positive, indicating that the underlying bullish structure has not been broken, but the red bars are continuously narrowing, indicating that the upward momentum is gradually weakening and lacking a signal for a new round of volume-driven upward movement. The RSI is in a neutral-to-strong range around 62, neither entering the overbought zone above 70 nor falling below the 50 support/resistance level, confirming the current balanced state of the bulls and bears. The probability of a short-term one-sided trend is low; back-and-forth movement is the main characteristic. The subsequent market movement can be observed under two core scenarios. A bullish path requires the price to hold the 99.15 support level and close above 102.49 to have a chance to challenge the strong resistance level of 106.75 again. Only by breaking through this trendline resistance can greater upward potential be opened. Conversely, if the price continues to be under pressure and effectively breaks below 99.15, it means that the short-term bullish consolidation has turned into a deep correction, and the market will test the strong support level of 96.81. If this level is also breached, the upward channel structure that has lasted for several months will be impacted, and the medium-term trend logic needs to be reassessed. Finally, it should be noted that the fundamentals of crude oil are highly volatile; geopolitical news, OPEC+ policies, and inventory data could all quickly disrupt the current technical consolidation structure. This daily technical analysis only reflects the strength of bulls and bears on the price chart itself and should not be used as the sole basis for trading. During directional breakouts, the weight given to one-sided predictions should be reduced; instead, prioritize signals from breakouts or breakdowns of key support and resistance levels. Wait for the market to establish a clear direction before applying any corresponding trading strategy.- Risk Warning and Disclaimer
- The market involves risk, and trading may not be suitable for all investors. This article is for reference only and does not constitute personal investment advice, nor does it take into account certain users’ specific investment objectives, financial situation, or other needs. Any investment decisions made based on this information are at your own risk.