Gold prices were again dragged down by forced liquidations, and losses in the equity market widened.
2026-10-30 18:44:25
Yesterday, another sell-off in the stock market put pressure on precious metals, with gold also facing renewed stress. Gold has recently been highly correlated with the stock market, and this latest decline appears to stem from investors selling assets to cover losses in other parts of their portfolios.  Chart: You can see the correlation between the Nasdaq index (blue line) and gold (candlestick chart).
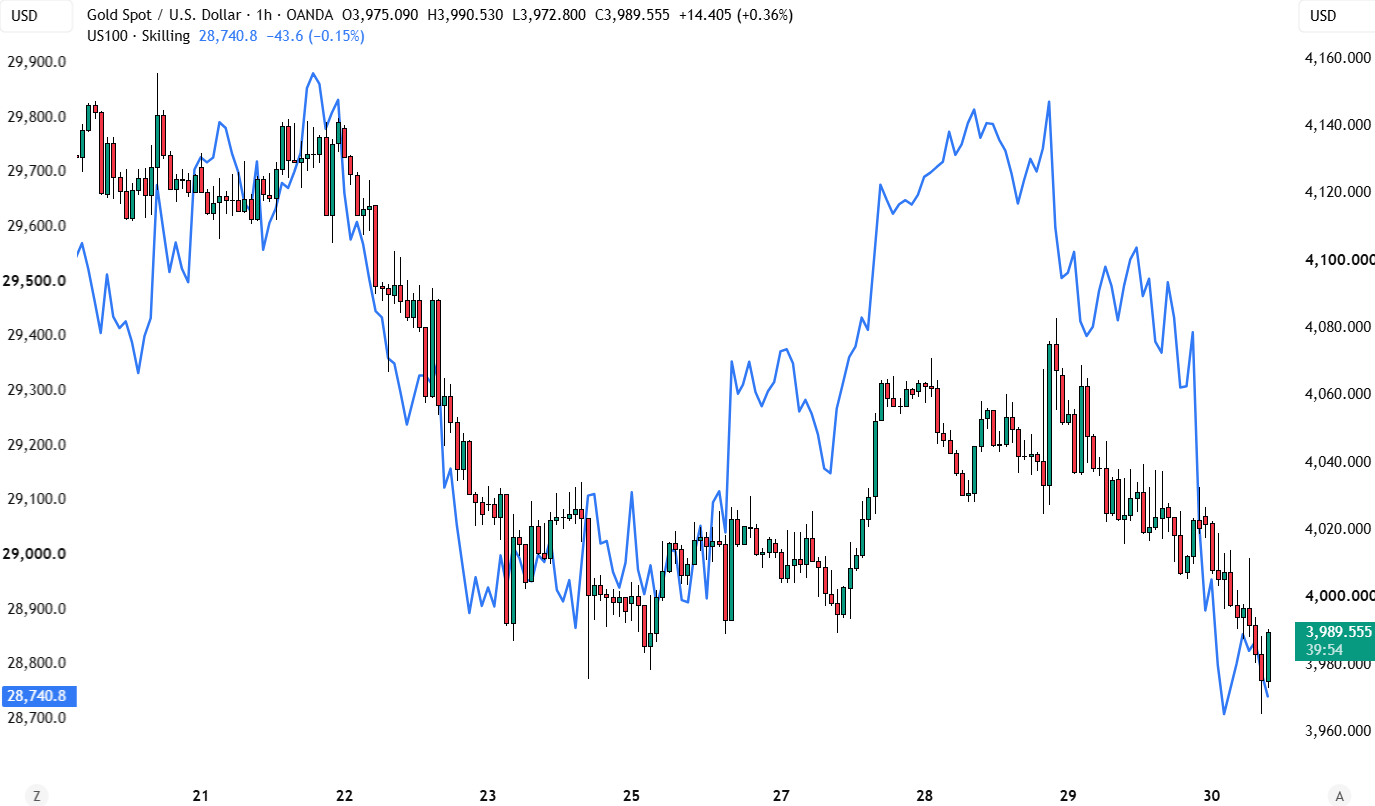 To understand this mechanism, imagine an investment fund that holds stocks, gold, and government bonds. One day, the stock market suddenly crashes, and the fund suffers losses on its leveraged positions. The fund may need to raise cash to meet margin calls, reduce leverage, or satisfy investor redemptions. In this situation, it might not only sell the assets that caused the losses, but also any assets that can be quickly converted into cash. Gold is particularly useful in such scenarios because it is highly liquid and can be sold rapidly. Key drivers such as real yields have actually consistently pointed to higher gold prices. In fact, real yields have fallen significantly as rising oil prices have kept inflation expectations largely unchanged, while nominal US Treasury yields have fallen due to safe-haven buying triggered by stock market losses. In the chart below, we can also see an unusual divergence between spot gold and ETF holdings. Normally, spot prices lead ETF inflows and outflows, but in the current situation, I believe it is technical factors, rather than fundamental factors, that are suppressing the upside potential of gold prices.
 Once this artificial selling pressure on gold eases, we could see a strong and rapid rebound. We are also gradually entering a typically favorable seasonal period – between December and January. The challenge lies in timing. Traders can rely on key technical levels or wait for fundamental catalysts. Potential catalysts include a breakthrough in US-Iran negotiations, dovish comments from the Federal Reserve, or weaker US economic data. Gold Technical Analysis – Daily Chart
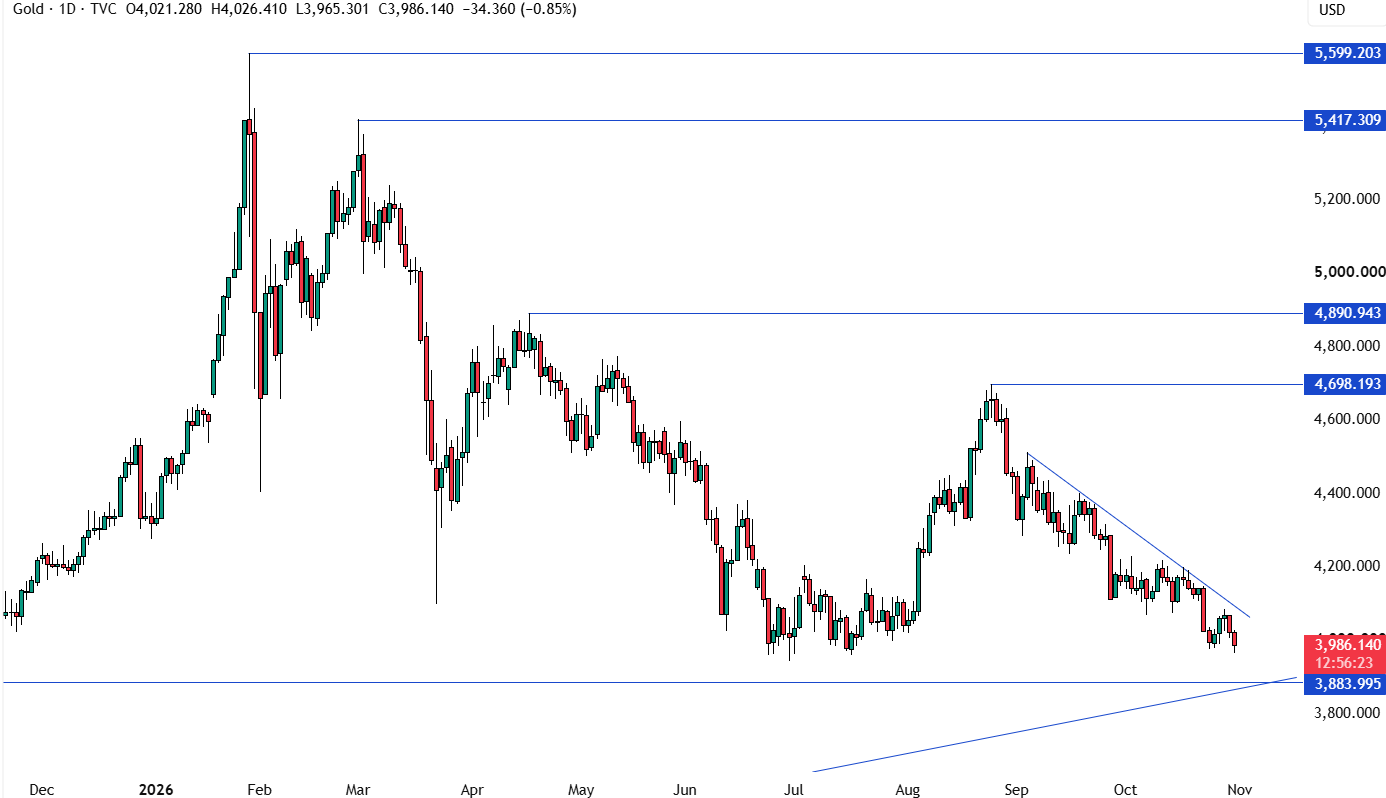 On the daily chart, we can see that gold prices have continued their decline and are approaching the strong support area around 3,885. If the price reaches this area, we can expect buyers to enter the market, clearly positioning themselves below the major uptrend line to prepare for a move towards new all-time highs. On the other hand, sellers will look for opportunities to break below this trendline to increase their bearish bets, targeting the 3,500 level. Gold Technical Analysis – 4-Hour Chart
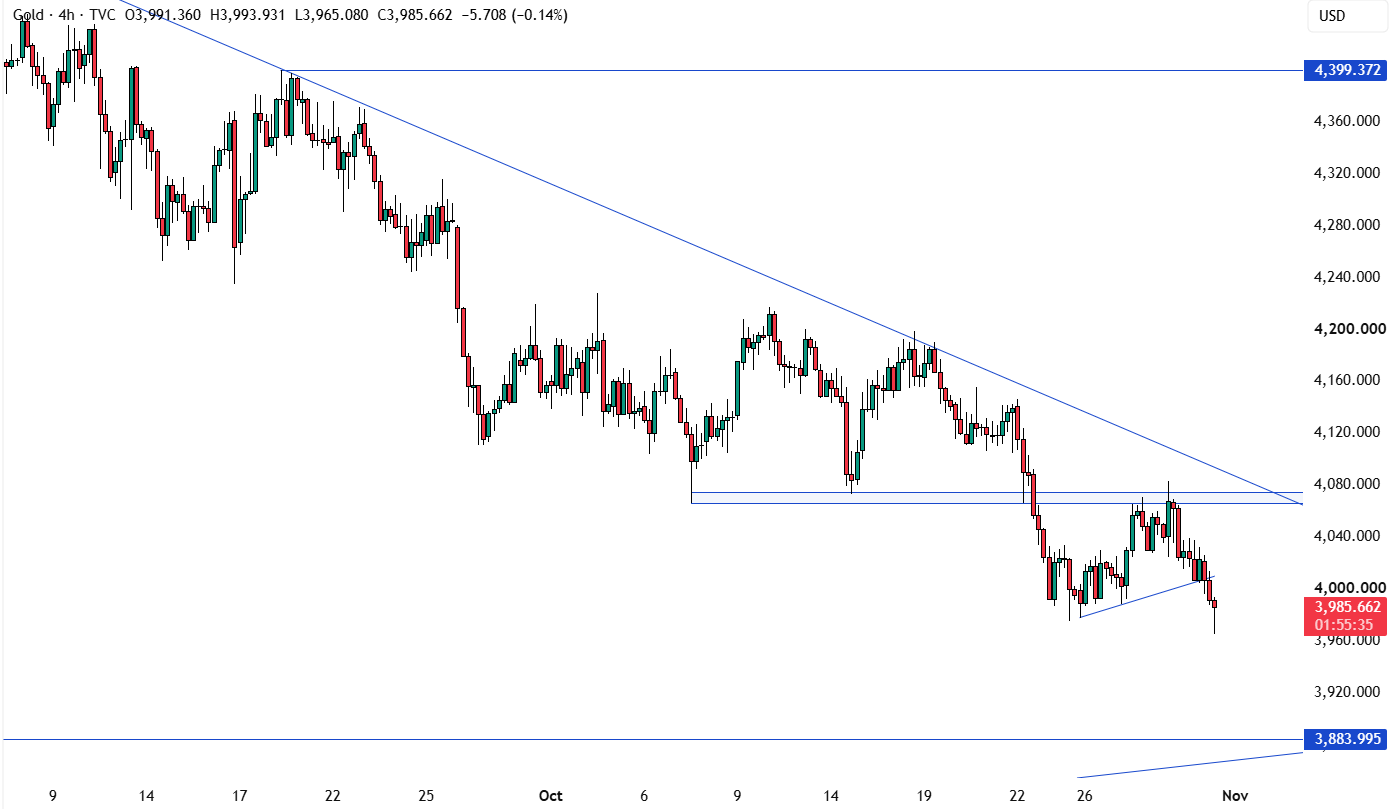 On the 4-hour chart, we can see that the price broke below the secondary uptrend line yesterday and continued its decline, driven by increased bearish bets from sellers, targeting the 3,885 level. If a rebound occurs before reaching 3,885, we can expect sellers to use the downtrend line as a base, setting risk above it and continuing to pressure for new lows. On the other hand, buyers will look for an upward breakout opportunity to open the door to new highs and position themselves to challenge the 4,400 level. Gold Technical Analysis – 1-Hour Timeframe
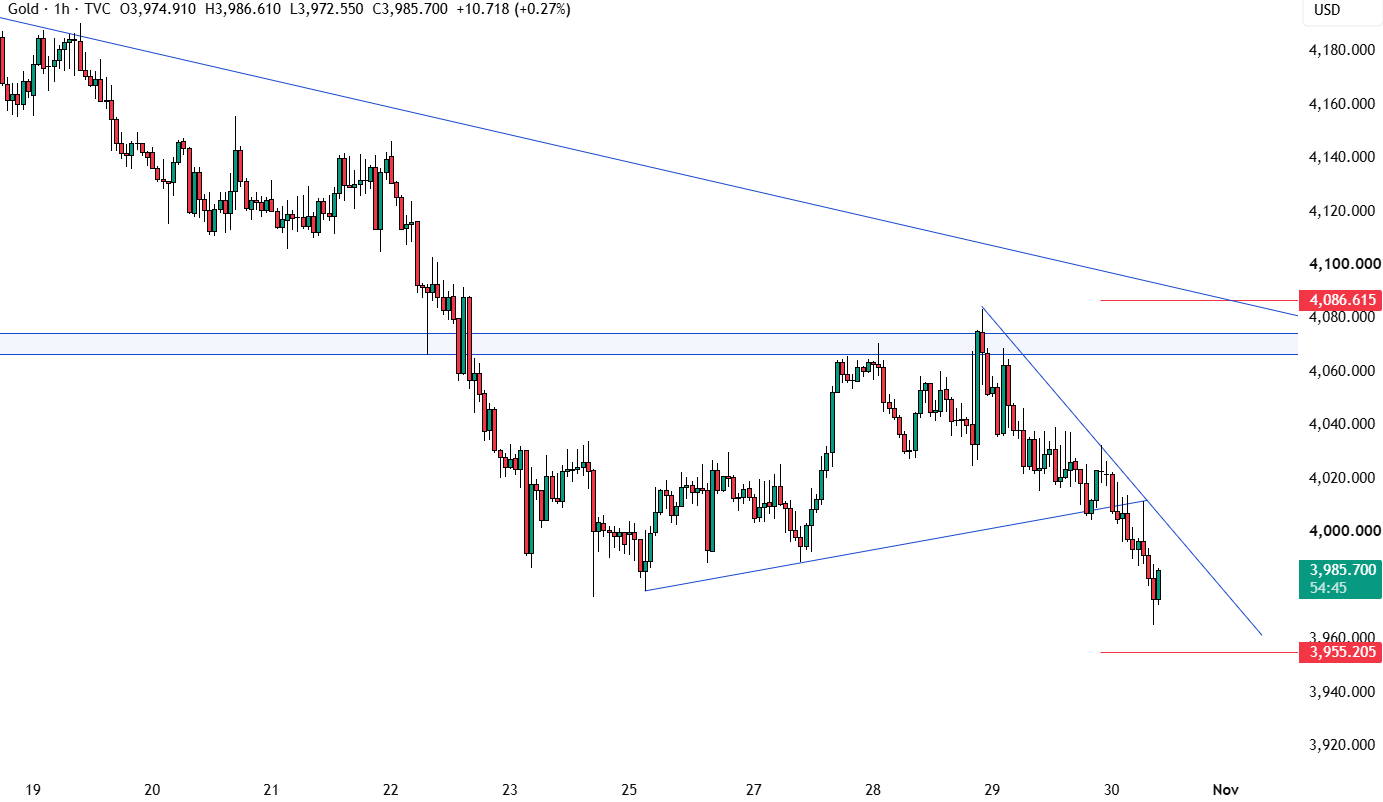 On the 1-hour chart, a secondary downtrend line defines the bearish momentum for this period. We can expect sellers to continue using this trendline, positioning their risk above it and targeting new lows. On the other hand, buyers will look for upward breakouts to position for a rebound towards the primary downtrend line. The red line marks the average true range for the day. Upcoming Catalysts This week concludes with the US Employment Cost Index.
Chart: You can see the correlation between the Nasdaq index (blue line) and gold (candlestick chart). To understand this mechanism, imagine an investment fund that holds stocks, gold, and government bonds. One day, the stock market suddenly crashes, and the fund suffers losses on its leveraged positions. The fund may need to raise cash to meet margin calls, reduce leverage, or satisfy investor redemptions. In this situation, it might not only sell the assets that caused the losses, but also any assets that can be quickly converted into cash. Gold is particularly useful in such scenarios because it is highly liquid and can be sold rapidly. Key drivers such as real yields have actually consistently pointed to higher gold prices. In fact, real yields have fallen significantly as rising oil prices have kept inflation expectations largely unchanged, while nominal US Treasury yields have fallen due to safe-haven buying triggered by stock market losses. In the chart below, we can also see an unusual divergence between spot gold and ETF holdings. Normally, spot prices lead ETF inflows and outflows, but in the current situation, I believe it is technical factors, rather than fundamental factors, that are suppressing the upside potential of gold prices. Once this artificial selling pressure on gold eases, we could see a strong and rapid rebound. We are also gradually entering a typically favorable seasonal period – between December and January. The challenge lies in timing. Traders can rely on key technical levels or wait for fundamental catalysts. Potential catalysts include a breakthrough in US-Iran negotiations, dovish comments from the Federal Reserve, or weaker US economic data. Gold Technical Analysis – Daily Chart On the daily chart, we can see that gold prices have continued their decline and are approaching the strong support area around 3,885. If the price reaches this area, we can expect buyers to enter the market, clearly positioning themselves below the major uptrend line to prepare for a move towards new all-time highs. On the other hand, sellers will look for opportunities to break below this trendline to increase their bearish bets, targeting the 3,500 level. Gold Technical Analysis – 4-Hour Chart On the 4-hour chart, we can see that the price broke below the secondary uptrend line yesterday and continued its decline, driven by increased bearish bets from sellers, targeting the 3,885 level. If a rebound occurs before reaching 3,885, we can expect sellers to use the downtrend line as a base, setting risk above it and continuing to pressure for new lows. On the other hand, buyers will look for an upward breakout opportunity to open the door to new highs and position themselves to challenge the 4,400 level. Gold Technical Analysis – 1-Hour Timeframe On the 1-hour chart, a secondary downtrend line defines the bearish momentum for this period. We can expect sellers to continue using this trendline, positioning their risk above it and targeting new lows. On the other hand, buyers will look for upward breakouts to position for a rebound towards the primary downtrend line. The red line marks the average true range for the day. Upcoming Catalysts This week concludes with the US Employment Cost Index.
- Risk Warning and Disclaimer
- The market involves risk, and trading may not be suitable for all investors. This article is for reference only and does not constitute personal investment advice, nor does it take into account certain users’ specific investment objectives, financial situation, or other needs. Any investment decisions made based on this information are at your own risk.