Gold falls below $4,000, facing monthly pressure due to the combined effects of oil prices and interest rate hike expectations.
2026-10-30 21:00:24
On Friday, October 30th, spot gold prices fell below the key psychological level of $4,000 per ounce, currently trading around $3,960 per ounce, the lowest level since mid-July, and on track for a second consecutive monthly decline. Meanwhile, Brent crude oil prices rose to their highest level since April due to escalating tensions in the Middle East, exacerbating inflationary pressures; continued corrections in technology stocks increased the risk of investors selling precious metals to cover stock losses. The Federal Reserve kept policy rates unchanged this week but left room for a rate hike before the end of the year, with the market pricing in a December rate hike probability of approximately 70%. 
Interest rate expectations and inflationary pressures intertwine
The Federal Reserve maintained its target range for the federal funds rate at 3.75% to 4.00% this week, with a vote of 10 in favor and 2 against, indicating that those opposed favoring a rate hike. Following the meeting, the market's pricing in a December rate hike rose to approximately 70%, with some data sources showing even higher figures. As a non-interest-bearing asset, gold faces pressure from rising holding costs when real interest rate expectations are revised upwards. Brent crude oil prices rose to their highest level since April due to concerns about the Middle East conflict, and the increase in oil prices pushed up inflation expectations through the energy cost channel, forcing investors to reassess the interest rate path. The resonance between inflationary pressures and expectations of monetary tightening continues to exert downward pressure on non-interest-bearing precious metals. In previous months, gold had already recorded a significant decline against the backdrop of high energy prices, with a cumulative drop of over 4% in October. In this environment, the pricing logic of interest rate-sensitive assets leans more towards valuation compression caused by rising discount rates, rather than the immediate manifestation of traditional safe-haven attributes.Equity market adjustment and liquidity transmission
Tech stocks led global equities for the second consecutive day, with another round of disappointing earnings reports accelerating the rotation of funds away from AI-related trades. The previous week's AI-driven sell-off had already dragged spot gold to its lowest level since July. Commodity strategist Ole Hansen pointed out that the market is watching whether the stock sell-off will extend into Wall Street trading hours, potentially triggering broader deleveraging and liquidity-driven cross-market selling. In an environment of concentrated leverage, forced liquidations in the equity market could transmit to precious metals holdings through margin pressures. While gold has long-term investment attributes, it remains vulnerable to deleveraging under short-term liquidity shocks. Hansen also emphasized that despite the short-term deleveraging risks, long-term investors' hedging needs for fiscal and geopolitical risks still provide some support. This tug-of-war between bullish and bearish forces has caused precious metal prices to repeatedly weigh between interest rates and liquidity factors.Divergence within precious metals: A comparison between gold and silver
Silver prices fell more than 3% over the same period, nearing $50 per ounce, with a cumulative decline of over 16% in October, erasing all gains since early December. Silver had previously experienced a two-month surge, peaking above $120 per ounce. The gold-silver ratio rose to its highest level since December, meaning an increase in the number of ounces of silver needed to purchase the same amount of gold. Ole Hansen stated that although silver has entered oversold territory, the risk of further long liquidation by technology-driven funds and momentum-driven selling remains, potentially opening up room for a move towards the mid-$40 area. This divergence highlights silver's continued vulnerability relative to gold. Gold continues to attract demand from investors less sensitive to interest rate developments, while silver is simultaneously influenced by both industrial demand expectations and speculative positions. ETF holdings are relatively stable, contrasting with a significant decline in speculative net long positions, indicating a difference between short-term and long-term funding behavior.Technical Analysis and Market Structure
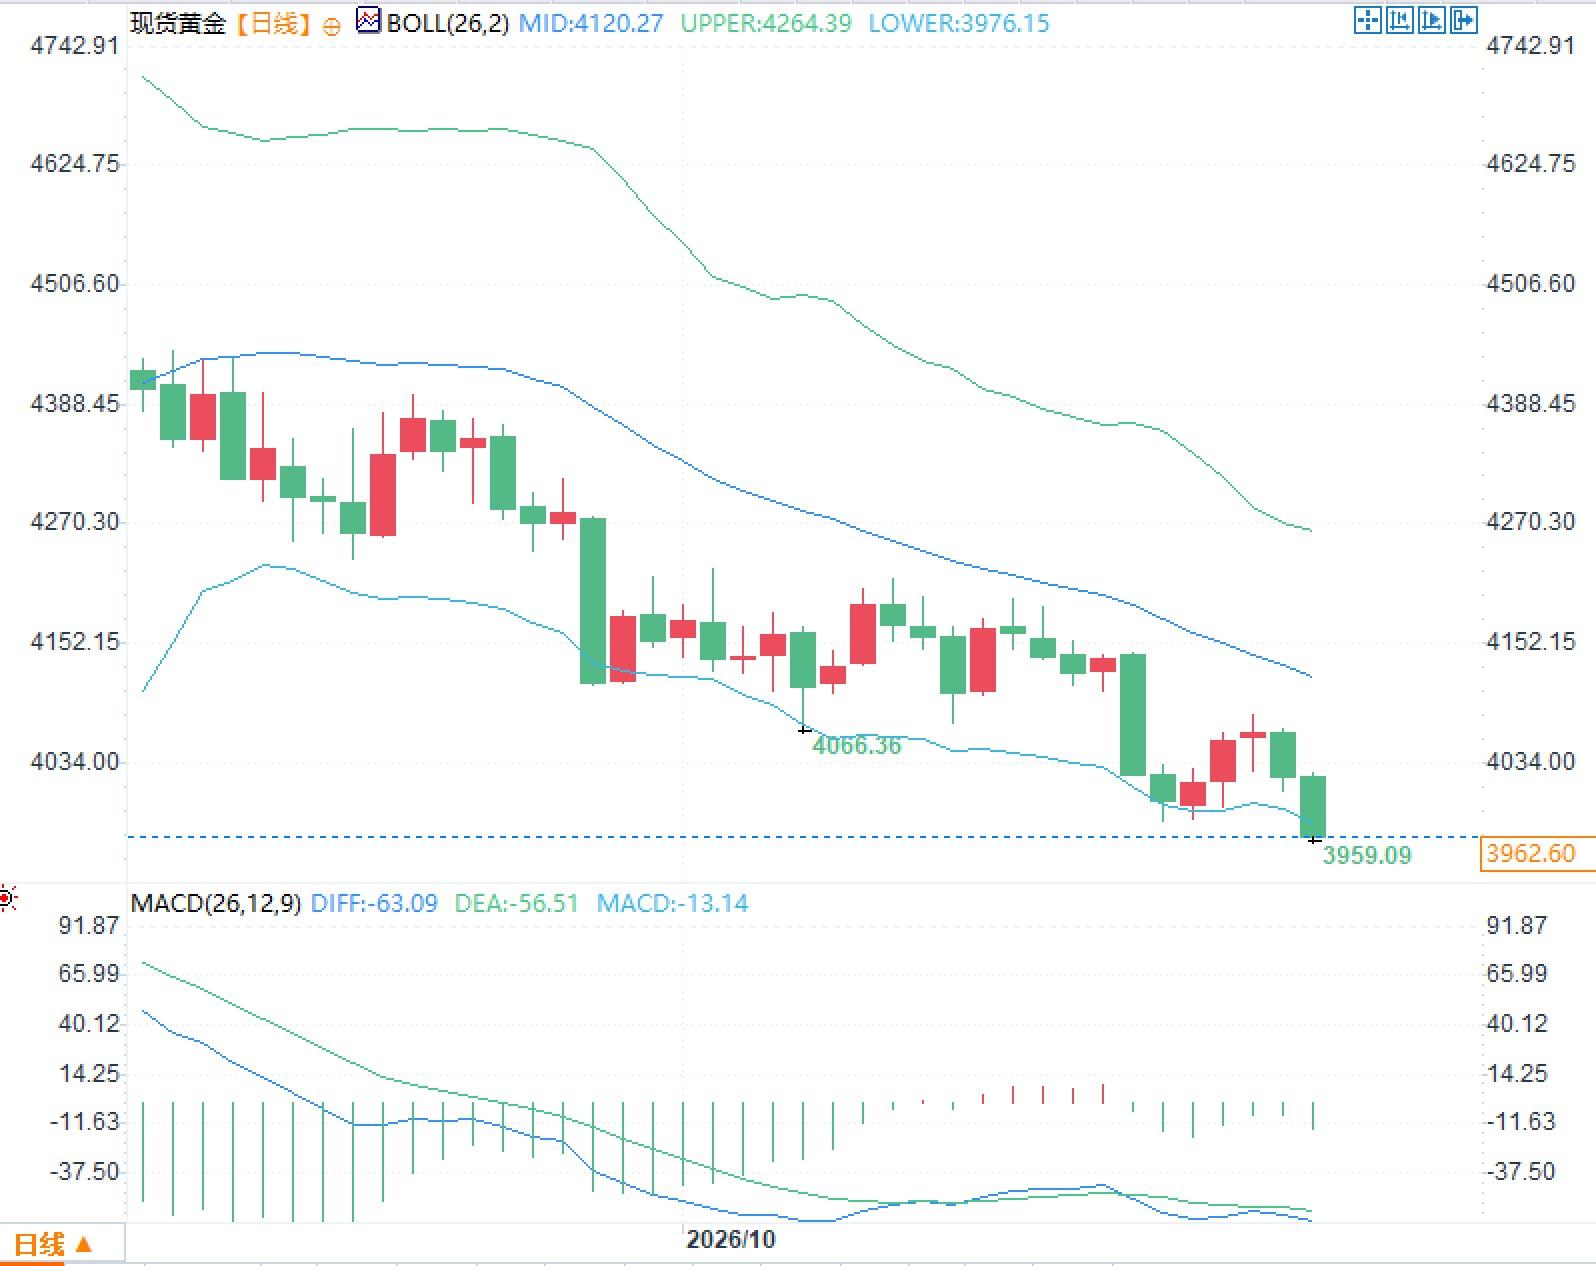
On the daily chart for spot gold, the Bollinger Band middle line is located at approximately $4120/oz, the upper line at approximately $4264/oz, and the lower line at approximately $3976/oz. The current price is trading below the middle line and approaching the lower line area. The MACD shows the DIFF at approximately -63, the DEA at approximately -57, and the MACD histogram at approximately -13, all below the zero line. The relative position of the price to the moving average system and the negative state of the momentum indicator reflect a weak trading rhythm recently. Structurally, there is a significant gap between the previous high area and the current price, while the area near the lower Bollinger Band forms a dense trading reference zone recently. Liquidity conditions, changes in interest rate expectations, and cross-market capital flows remain the core variables influencing the structural evolution.Frequently Asked Questions
Question 1: What are the main driving factors behind the drop in spot gold below $4,000/ounce? Answer: Primarily, it stems from inflationary pressures on Brent crude oil, driven by concerns about the Middle East conflict leading to its highest level since April, and the increased holding costs pushed up by the Fed maintaining interest rates and leaving room for a December rate hike, with the market pricing in a probability of approximately 70%. Potential deleveraging triggered by the sell-off in tech stocks also increased liquidity pressures. Question 2: Why did silver fall significantly more than gold? Answer: Silver was simultaneously affected by speculative position liquidation and expectations of industrial demand, erasing all gains since early December, with the gold-silver ratio rising to its highest level since December. Ole Hansen points out that despite entering oversold territory, the risk of further liquidation by technical funds remains. Gold, on the other hand, attracts demand that is less sensitive to interest rates.- Risk Warning and Disclaimer
- The market involves risk, and trading may not be suitable for all investors. This article is for reference only and does not constitute personal investment advice, nor does it take into account certain users’ specific investment objectives, financial situation, or other needs. Any investment decisions made based on this information are at your own risk.