













The US dollar weakened again, with the midterm elections becoming the main focus of the foreign exchange market.
2026-11-02 19:22:25
On Monday (November 2), the US dollar weakened slightly at the start of the week, its movement possibly driven by oil prices. Reports indicated that US President Trump wanted to leave room for diplomatic maneuvering with Iran, causing oil prices to fall by 2%-3%. This reversed market sentiment last Friday—when many traders were betting on a new round of attacks this weekend.  This week's core focus is the US midterm elections. Betting markets give a 70%-72% probability of the Democrats winning both the House and Senate. Some believe that if this outcome occurs, the dollar should weaken: this would likely trigger a debt ceiling impasse, a prolonged government shutdown next year, and could also prompt Trump to pursue a tougher, more aggressive foreign policy. However, most of this is speculation. The confirmed facts are: US Q3 annualized quarter-on-quarter GDP growth reached 3.4%, inflation has been above target for six consecutive years, and the Federal Reserve is preparing to tighten monetary policy again. This week will see the release of the ISM business survey and employment data, continuing to provide clues to the main US macroeconomic trends. The market expects the business survey to remain optimistic, while price pressures remain high; Friday's October employment report is expected to see a modest rebound after the weak September data. Unless Friday's employment data is extremely dismal, it is unlikely to change the Fed's tightening path; price-related data are the more crucial variable. Furthermore, selling pressure on tech stocks remains worth monitoring. Apple will release its earnings report after the market closes today. The Nasdaq Composite Index fell 9% last month, which has already led to a decline in short-term US interest rates. A further sharp sell-off in the technology sector could be the biggest risk to long dollar positions. The dollar index is expected to fluctuate around 102.00. Technical Analysis
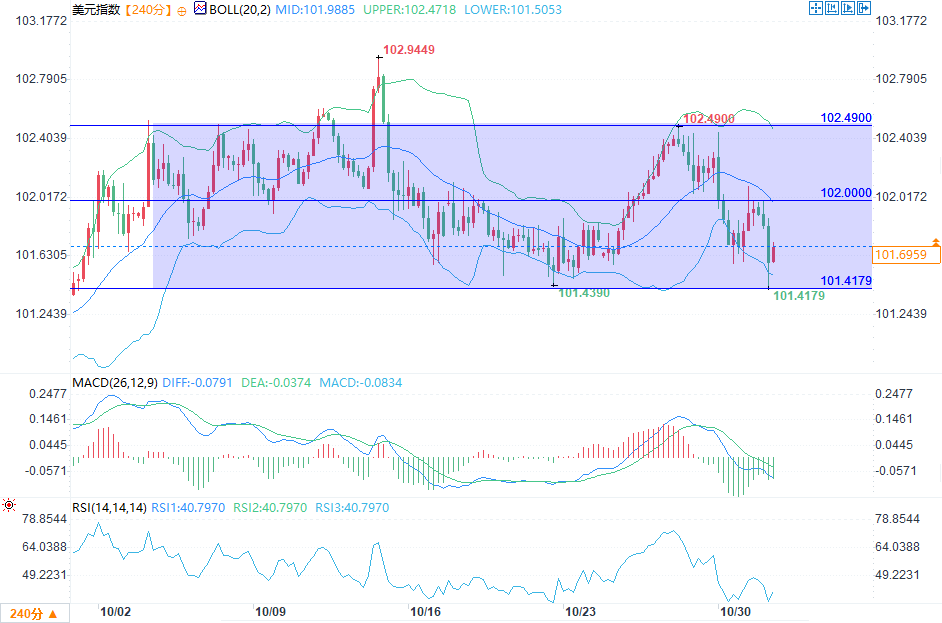 (US Dollar Index 4-hour chart source: FX678) Since October, the US Dollar Index has been oscillating between 101.42 and 102.49, with the price center around 102. In the short term, it is highly likely to continue fluctuating around this level. The current pullback from the high of 102.49 can be seen as an adjustment within the trading range. The current Bollinger Band middle line is at 101.9889, roughly coinciding with the 102 psychological center, making it the primary resistance level for this rebound. The upper line at 102.4712 resonates with the upper edge of the trading range at 102.49, acting as strong resistance. The lower line at 101.5065 is close to the support level of 101.4179. The current price has fallen below the Bollinger Band middle line, indicating short-term weakness on the 4-hour chart, and is testing the lower support. As long as the price does not effectively break above the upper Bollinger Band or fall below the lower Bollinger Band, the Bollinger Bands will maintain their oscillating nature, making a one-sided trend unlikely. The MACD indicator on the secondary chart currently shows the DIFF line below the DEA line, with the green bars continuing to diverge, indicating that bearish momentum is being released. The RSI reading is 41.1053, which has not yet entered the oversold zone below 30, suggesting that the bears still have room to exert further pressure.
This week's core focus is the US midterm elections. Betting markets give a 70%-72% probability of the Democrats winning both the House and Senate. Some believe that if this outcome occurs, the dollar should weaken: this would likely trigger a debt ceiling impasse, a prolonged government shutdown next year, and could also prompt Trump to pursue a tougher, more aggressive foreign policy. However, most of this is speculation. The confirmed facts are: US Q3 annualized quarter-on-quarter GDP growth reached 3.4%, inflation has been above target for six consecutive years, and the Federal Reserve is preparing to tighten monetary policy again. This week will see the release of the ISM business survey and employment data, continuing to provide clues to the main US macroeconomic trends. The market expects the business survey to remain optimistic, while price pressures remain high; Friday's October employment report is expected to see a modest rebound after the weak September data. Unless Friday's employment data is extremely dismal, it is unlikely to change the Fed's tightening path; price-related data are the more crucial variable. Furthermore, selling pressure on tech stocks remains worth monitoring. Apple will release its earnings report after the market closes today. The Nasdaq Composite Index fell 9% last month, which has already led to a decline in short-term US interest rates. A further sharp sell-off in the technology sector could be the biggest risk to long dollar positions. The dollar index is expected to fluctuate around 102.00. Technical Analysis (US Dollar Index 4-hour chart source: FX678) Since October, the US Dollar Index has been oscillating between 101.42 and 102.49, with the price center around 102. In the short term, it is highly likely to continue fluctuating around this level. The current pullback from the high of 102.49 can be seen as an adjustment within the trading range. The current Bollinger Band middle line is at 101.9889, roughly coinciding with the 102 psychological center, making it the primary resistance level for this rebound. The upper line at 102.4712 resonates with the upper edge of the trading range at 102.49, acting as strong resistance. The lower line at 101.5065 is close to the support level of 101.4179. The current price has fallen below the Bollinger Band middle line, indicating short-term weakness on the 4-hour chart, and is testing the lower support. As long as the price does not effectively break above the upper Bollinger Band or fall below the lower Bollinger Band, the Bollinger Bands will maintain their oscillating nature, making a one-sided trend unlikely. The MACD indicator on the secondary chart currently shows the DIFF line below the DEA line, with the green bars continuing to diverge, indicating that bearish momentum is being released. The RSI reading is 41.1053, which has not yet entered the oversold zone below 30, suggesting that the bears still have room to exert further pressure.- Risk Warning and Disclaimer
- The market involves risk, and trading may not be suitable for all investors. This article is for reference only and does not constitute personal investment advice, nor does it take into account certain users’ specific investment objectives, financial situation, or other needs. Any investment decisions made based on this information are at your own risk.