













A weaker US dollar index supported a correction in gold prices after they were oversold, leading to a return to range-bound trading.
2026-11-05 10:06:25
Gold prices surged in Asian trading on Thursday, climbing to around $4,125, a single-day gain of over 3.6%, marking the largest single-day increase since mid-August. The core driver of this precious metals rebound was the US midterm election results, with the Democrats gaining control of both the Senate and the House of Representatives. The market widely interprets this as a potential policy deadlock in Washington, significantly increasing the difficulty of advancing fiscal expansion.  Impacted by this expectation, the US dollar index fell sharply on Wednesday, dropping to its lowest level in over a month. Gold, priced in US dollars, received a direct boost, as a weaker dollar reduced the cost of purchase for overseas buyers, attracting a large influx of funds into the precious metals market. However, balancing factors remain in place. The risk of inflation has not been completely eliminated, and oil prices remain high, limiting the Federal Reserve's room for further easing. Gold is a non-interest-bearing asset, and rising interest rates increase the opportunity cost of holding gold, putting downward pressure on prices. The CME FedWatch tool shows that the market still prices an 82.7% probability of a Fed rate hike in December, and this high expectation has not diminished quickly following the election results. Institutional views indicate that the market is hoping for new congressional measures to address inflation, with energy prices being a crucial factor. Scotiabank analysis noted that gold's nearly 3% single-day surge firmly established itself above the important psychological level of $4,000, while silver saw a simultaneous increase of nearly 5%. The recent surge in precious metals is a result of a weakening dollar coupled with market concerns about the US fiscal outlook. The repricing of fiscal uncertainty has directly impacted the gold market. While gold prices have rebounded strongly, this does not signify a complete trend reversal. The US September non-farm payroll report, due this Friday, is crucial. The strength or weakness of the employment data will recalibrate market pricing in a Fed rate hike at the end of the year. If the employment data shows resilience again, US Treasury yields may rebound, potentially putting downward pressure on gold prices; conversely, a significant cooling in employment data would further amplify the current gold rebound. In addition, Middle East geopolitical tensions and progress in US-Iran negotiations will intermittently disrupt safe-haven demand. Investors need to consider multiple signals to determine the sustainability of the market trend. On the daily chart, spot gold has just experienced a significant rebound, currently priced at 4125. The price remains below the 20-period moving average and the 100-day simple moving average, indicating that the short-term bearish trend has not yet been completely reversed. The 14-period RSI indicator is rising, gradually approaching the overbought zone, indicating a strong recovery from the lows. However, structural selling pressure remains, and the price will likely face significant selling pressure after the rebound. The first resistance level is the 20-day Bollinger Band middle line at 4075 (already broken), followed by the 100-day moving average at 4205, with the upper Bollinger Band at 4255 providing even stronger resistance. The primary support level is now the 20-day Bollinger Band middle line at 4075, followed by the lower Bollinger Band at 3900. A break below 4075 would slow the current rebound and trigger a retest of lower support levels. As long as this support holds, gold prices will maintain a wide-range consolidation pattern after the rebound. On the 4-hour chart, the price action shows consecutive large bullish candles, with short-term moving averages rapidly turning upwards, indicating a concentrated release of short-term bullish momentum. The RSI has entered the overbought zone, suggesting a potential technical pullback in the short term. The short-term rebound is strong, but it is important to observe the effectiveness of breaking through the 4205 resistance level. Only if it holds above this level can the rebound continue. If it encounters resistance and falls back after rising to this point, it is likely to enter a period of high-level consolidation.
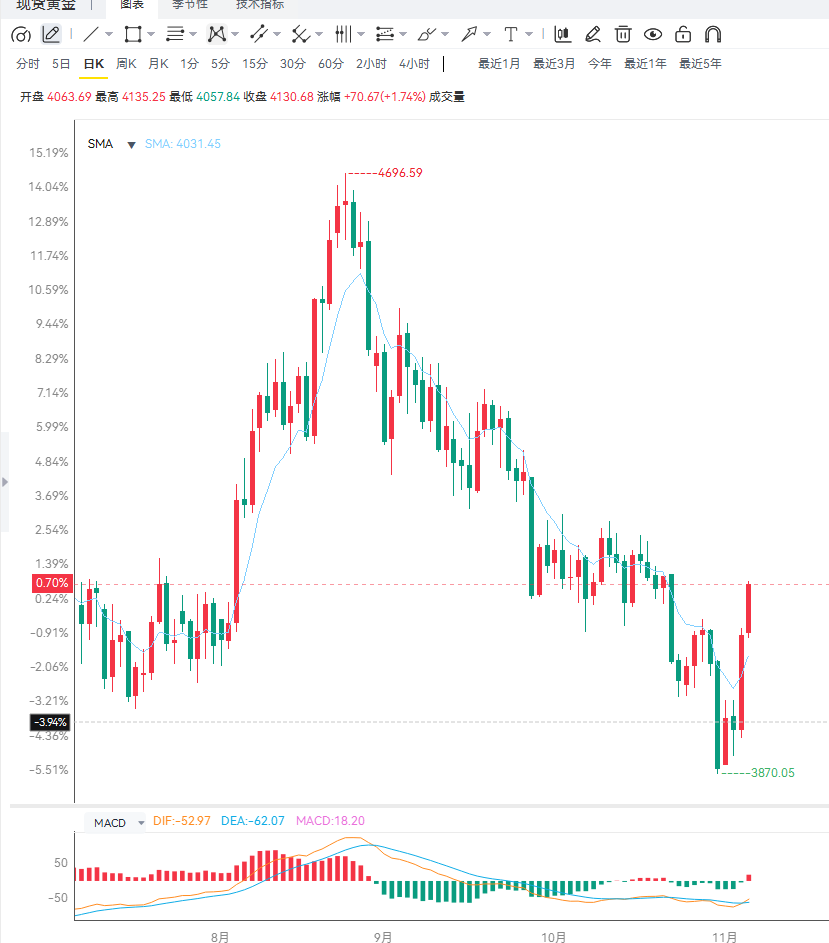 Editor's Summary: The Democratic sweep of both houses of Congress in the midterm elections led to a significant weakening of the US dollar, driving a retaliatory rebound in gold prices, which rose to $4125. However, the expectation of a high rate hike by the Federal Reserve in December still hangs over the market, and the large-scale bearish structure has not been completely broken, so a trend reversal cannot be directly confirmed. Short-term risks lie in stronger-than-expected non-farm payroll data, a rebound in US Treasury yields, and a pullback in gold prices after the initial surge. A potential opportunity is weaker-than-expected employment data, further weakening rate hike expectations and allowing gold prices to break through the key resistance level of $4205. Closely monitor the $4205 resistance and $4075 support levels. Volatility will increase sharply before and after the release of the non-farm payroll data; chasing highs and lows is not advisable.
Impacted by this expectation, the US dollar index fell sharply on Wednesday, dropping to its lowest level in over a month. Gold, priced in US dollars, received a direct boost, as a weaker dollar reduced the cost of purchase for overseas buyers, attracting a large influx of funds into the precious metals market. However, balancing factors remain in place. The risk of inflation has not been completely eliminated, and oil prices remain high, limiting the Federal Reserve's room for further easing. Gold is a non-interest-bearing asset, and rising interest rates increase the opportunity cost of holding gold, putting downward pressure on prices. The CME FedWatch tool shows that the market still prices an 82.7% probability of a Fed rate hike in December, and this high expectation has not diminished quickly following the election results. Institutional views indicate that the market is hoping for new congressional measures to address inflation, with energy prices being a crucial factor. Scotiabank analysis noted that gold's nearly 3% single-day surge firmly established itself above the important psychological level of $4,000, while silver saw a simultaneous increase of nearly 5%. The recent surge in precious metals is a result of a weakening dollar coupled with market concerns about the US fiscal outlook. The repricing of fiscal uncertainty has directly impacted the gold market. While gold prices have rebounded strongly, this does not signify a complete trend reversal. The US September non-farm payroll report, due this Friday, is crucial. The strength or weakness of the employment data will recalibrate market pricing in a Fed rate hike at the end of the year. If the employment data shows resilience again, US Treasury yields may rebound, potentially putting downward pressure on gold prices; conversely, a significant cooling in employment data would further amplify the current gold rebound. In addition, Middle East geopolitical tensions and progress in US-Iran negotiations will intermittently disrupt safe-haven demand. Investors need to consider multiple signals to determine the sustainability of the market trend. On the daily chart, spot gold has just experienced a significant rebound, currently priced at 4125. The price remains below the 20-period moving average and the 100-day simple moving average, indicating that the short-term bearish trend has not yet been completely reversed. The 14-period RSI indicator is rising, gradually approaching the overbought zone, indicating a strong recovery from the lows. However, structural selling pressure remains, and the price will likely face significant selling pressure after the rebound. The first resistance level is the 20-day Bollinger Band middle line at 4075 (already broken), followed by the 100-day moving average at 4205, with the upper Bollinger Band at 4255 providing even stronger resistance. The primary support level is now the 20-day Bollinger Band middle line at 4075, followed by the lower Bollinger Band at 3900. A break below 4075 would slow the current rebound and trigger a retest of lower support levels. As long as this support holds, gold prices will maintain a wide-range consolidation pattern after the rebound. On the 4-hour chart, the price action shows consecutive large bullish candles, with short-term moving averages rapidly turning upwards, indicating a concentrated release of short-term bullish momentum. The RSI has entered the overbought zone, suggesting a potential technical pullback in the short term. The short-term rebound is strong, but it is important to observe the effectiveness of breaking through the 4205 resistance level. Only if it holds above this level can the rebound continue. If it encounters resistance and falls back after rising to this point, it is likely to enter a period of high-level consolidation. Editor's Summary: The Democratic sweep of both houses of Congress in the midterm elections led to a significant weakening of the US dollar, driving a retaliatory rebound in gold prices, which rose to $4125. However, the expectation of a high rate hike by the Federal Reserve in December still hangs over the market, and the large-scale bearish structure has not been completely broken, so a trend reversal cannot be directly confirmed. Short-term risks lie in stronger-than-expected non-farm payroll data, a rebound in US Treasury yields, and a pullback in gold prices after the initial surge. A potential opportunity is weaker-than-expected employment data, further weakening rate hike expectations and allowing gold prices to break through the key resistance level of $4205. Closely monitor the $4205 resistance and $4075 support levels. Volatility will increase sharply before and after the release of the non-farm payroll data; chasing highs and lows is not advisable.
- Risk Warning and Disclaimer
- The market involves risk, and trading may not be suitable for all investors. This article is for reference only and does not constitute personal investment advice, nor does it take into account certain users’ specific investment objectives, financial situation, or other needs. Any investment decisions made based on this information are at your own risk.