












The US dollar regained its upward momentum, while gold prices were capped below $4,150 as the non-farm payroll report approached.
2026-11-06 00:24:26
On Thursday (November 5), spot gold stalled its rebound as the dollar and U.S. Treasury yields resumed their upward trend after a sharp drop in the previous session – the decline triggered by the U.S. midterm election results, which exacerbated volatility in financial markets. Spot gold was trading around $4,101.50 during the session, after hitting an intraday high of $4,146, its highest level in two weeks.  Spot gold surged 3.64% on Wednesday, while West Texas Intermediate (WTI) crude oil plunged 8%, as traders speculated that a full Democratic control of Congress could limit Trump's funding for military action against Iran and increase pressure to end the nine-month-long war. Furthermore, the prospect of a divided government eased market concerns about the fiscal deficit, as passing new tax cuts or spending packages could become more difficult. This supported buying of US Treasuries and pushed yields down, thus weighing on the dollar. The decline in oil prices also somewhat alleviated inflation concerns, and these factors combined to fuel renewed demand for gold. On Thursday, the dollar index (DXY) traded around 101.60, recovering from an intraday low of 101.20. The yield on the 10-year US Treasury note rose to 4.89% from an earlier low of 4.83%. Meanwhile, the hawkish outlook from the Federal Reserve remains a key obstacle for gold prices. Oil prices remain well above pre-war levels, keeping inflation risks lingering. As of this writing, WTI crude oil was trading around $89.50 per barrel, up 1.65% on the day. Given the Federal Reserve's commitment to pulling inflation back to its 2% target, traders expect interest rates to remain high for an extended period and anticipate a December rate hike, with the CME FedWatch tool showing a probability of approximately 79%. Rising borrowing costs increase the opportunity cost of holding gold, putting pressure on non-interest-bearing assets. Cleveland Fed President Beth Hammack further reinforced the hawkish outlook on Thursday, stating that "monetary policy needs to shift to a restrained stance" because inflation is "too high and heading in the wrong direction." She added that "gradual rate hikes are the way to ensure the Fed pulls inflation back to 2%" with less disruption to the economy and financial system. On the data front, initial jobless claims in the U.S. fell to 189,000, below the expected 196,000 and the revised 195,000 from the previous week. The four-week moving average also fell to 194,750 from a revised 197,000. Market attention has now shifted to Friday's nonfarm payrolls report (NFP) for new clues about the Federal Reserve's policy path. Technical analysis: Bulls are targeting the 50-day and 100-day moving averages around $4200.
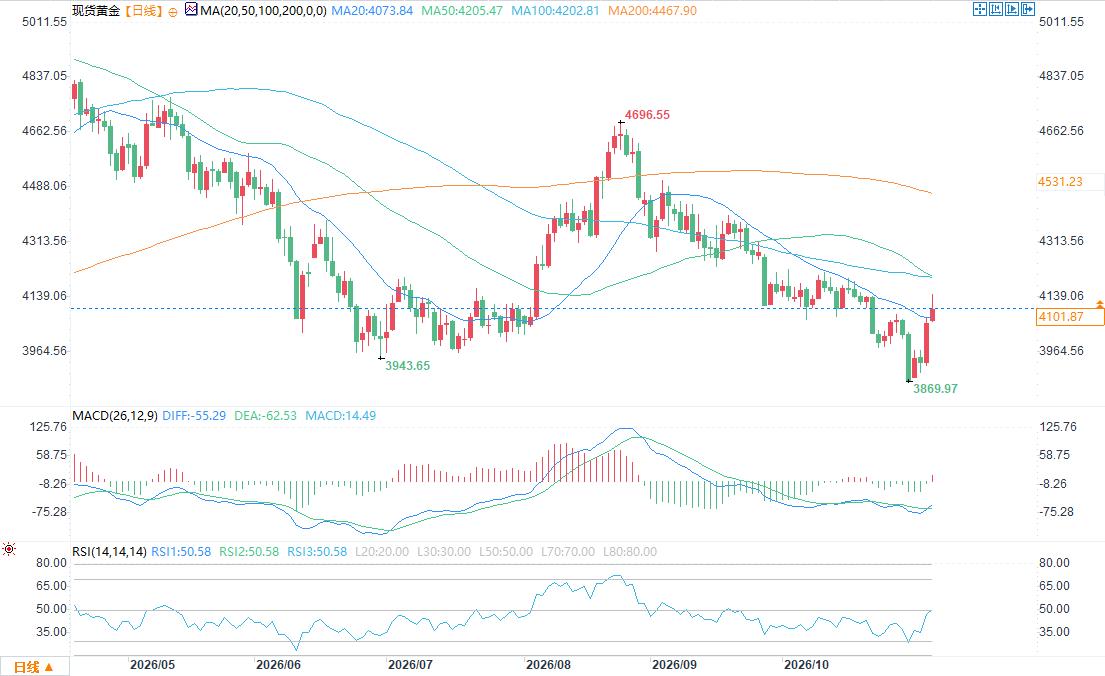 On the daily chart, spot gold prices remain constrained below medium- and long-term moving averages, maintaining a range-bound pattern. The 21-day simple moving average (SMA) at $4077 is currently providing support for any rebound and forming an immediate support level, but the price remains below the 50-day, 100-day, and 200-day SMAs. Momentum has improved somewhat, with the Relative Strength Index (RSI) near 51 and the Moving Average Convergence Divergence (MACD) turning positive, suggesting that bullish pressure is rebuilding, but the structurally bearish pattern has not yet been reversed. On the downside, initial support is seen at $4077 near the 21-day SMA, followed by the psychological level of $4000 and the year's low of $3870. On the upside, immediate resistance is seen at the closely adjacent 100-day and 50-day SMAs at $4203 and $4205, respectively. A more significant resistance level appears at $4468 near the 200-day SMA. Only a clear daily close above these moving average clusters will begin to alleviate the current dominant bearish bias.
Spot gold surged 3.64% on Wednesday, while West Texas Intermediate (WTI) crude oil plunged 8%, as traders speculated that a full Democratic control of Congress could limit Trump's funding for military action against Iran and increase pressure to end the nine-month-long war. Furthermore, the prospect of a divided government eased market concerns about the fiscal deficit, as passing new tax cuts or spending packages could become more difficult. This supported buying of US Treasuries and pushed yields down, thus weighing on the dollar. The decline in oil prices also somewhat alleviated inflation concerns, and these factors combined to fuel renewed demand for gold. On Thursday, the dollar index (DXY) traded around 101.60, recovering from an intraday low of 101.20. The yield on the 10-year US Treasury note rose to 4.89% from an earlier low of 4.83%. Meanwhile, the hawkish outlook from the Federal Reserve remains a key obstacle for gold prices. Oil prices remain well above pre-war levels, keeping inflation risks lingering. As of this writing, WTI crude oil was trading around $89.50 per barrel, up 1.65% on the day. Given the Federal Reserve's commitment to pulling inflation back to its 2% target, traders expect interest rates to remain high for an extended period and anticipate a December rate hike, with the CME FedWatch tool showing a probability of approximately 79%. Rising borrowing costs increase the opportunity cost of holding gold, putting pressure on non-interest-bearing assets. Cleveland Fed President Beth Hammack further reinforced the hawkish outlook on Thursday, stating that "monetary policy needs to shift to a restrained stance" because inflation is "too high and heading in the wrong direction." She added that "gradual rate hikes are the way to ensure the Fed pulls inflation back to 2%" with less disruption to the economy and financial system. On the data front, initial jobless claims in the U.S. fell to 189,000, below the expected 196,000 and the revised 195,000 from the previous week. The four-week moving average also fell to 194,750 from a revised 197,000. Market attention has now shifted to Friday's nonfarm payrolls report (NFP) for new clues about the Federal Reserve's policy path. Technical analysis: Bulls are targeting the 50-day and 100-day moving averages around $4200. On the daily chart, spot gold prices remain constrained below medium- and long-term moving averages, maintaining a range-bound pattern. The 21-day simple moving average (SMA) at $4077 is currently providing support for any rebound and forming an immediate support level, but the price remains below the 50-day, 100-day, and 200-day SMAs. Momentum has improved somewhat, with the Relative Strength Index (RSI) near 51 and the Moving Average Convergence Divergence (MACD) turning positive, suggesting that bullish pressure is rebuilding, but the structurally bearish pattern has not yet been reversed. On the downside, initial support is seen at $4077 near the 21-day SMA, followed by the psychological level of $4000 and the year's low of $3870. On the upside, immediate resistance is seen at the closely adjacent 100-day and 50-day SMAs at $4203 and $4205, respectively. A more significant resistance level appears at $4468 near the 200-day SMA. Only a clear daily close above these moving average clusters will begin to alleviate the current dominant bearish bias.
- Risk Warning and Disclaimer
- The market involves risk, and trading may not be suitable for all investors. This article is for reference only and does not constitute personal investment advice, nor does it take into account certain users’ specific investment objectives, financial situation, or other needs. Any investment decisions made based on this information are at your own risk.