













What variables are hidden behind Williams' statement of "gathering information" as the US dollar index approaches the 102 level?
2026-11-06 19:06:27
On Friday, November 6th, the US dollar index fluctuated around 102. New York Federal Reserve President John Williams spoke on the same day, noting the resilience of the US economy, strengthened growth, and a stable labor market. He also emphasized that tariff-related inflationary pressures had largely been transmitted, inflation expectations were well anchored, and it was appropriate to gather more information before making further policy decisions. This statement came just before the release of US employment data, further increasing the market's reliance on data regarding the Fed's policy path. The interplay of technical and fundamental information regarding the US dollar index has become a key focus of attention. 
The core content of Williams' speech
John Williams explicitly stated that the U.S. economy has demonstrated resilience in the face of unconventional shocks on both the supply and demand sides, with growth momentum strengthening. He described the labor market as stable and solid, believing that employment conditions support the overall economic outlook. Regarding inflation, the impact of tariffs has largely completed its transmission process, the pass-through of energy costs to prices is largely in line with expectations, long-term inflation expectations remain anchored, and wage growth is consistent with the 2% target. At the same time, he pointed out that inflation has been excessively high for a considerable period, necessitating a return to the 2% target at an appropriate time, and emphasized that the effects of monetary policy are lag-dependent and require forward-looking consideration. This series of statements signals that policy adjustments should not be rushed, and that the focus should be on observing subsequent data.Current technical pattern of the US dollar index
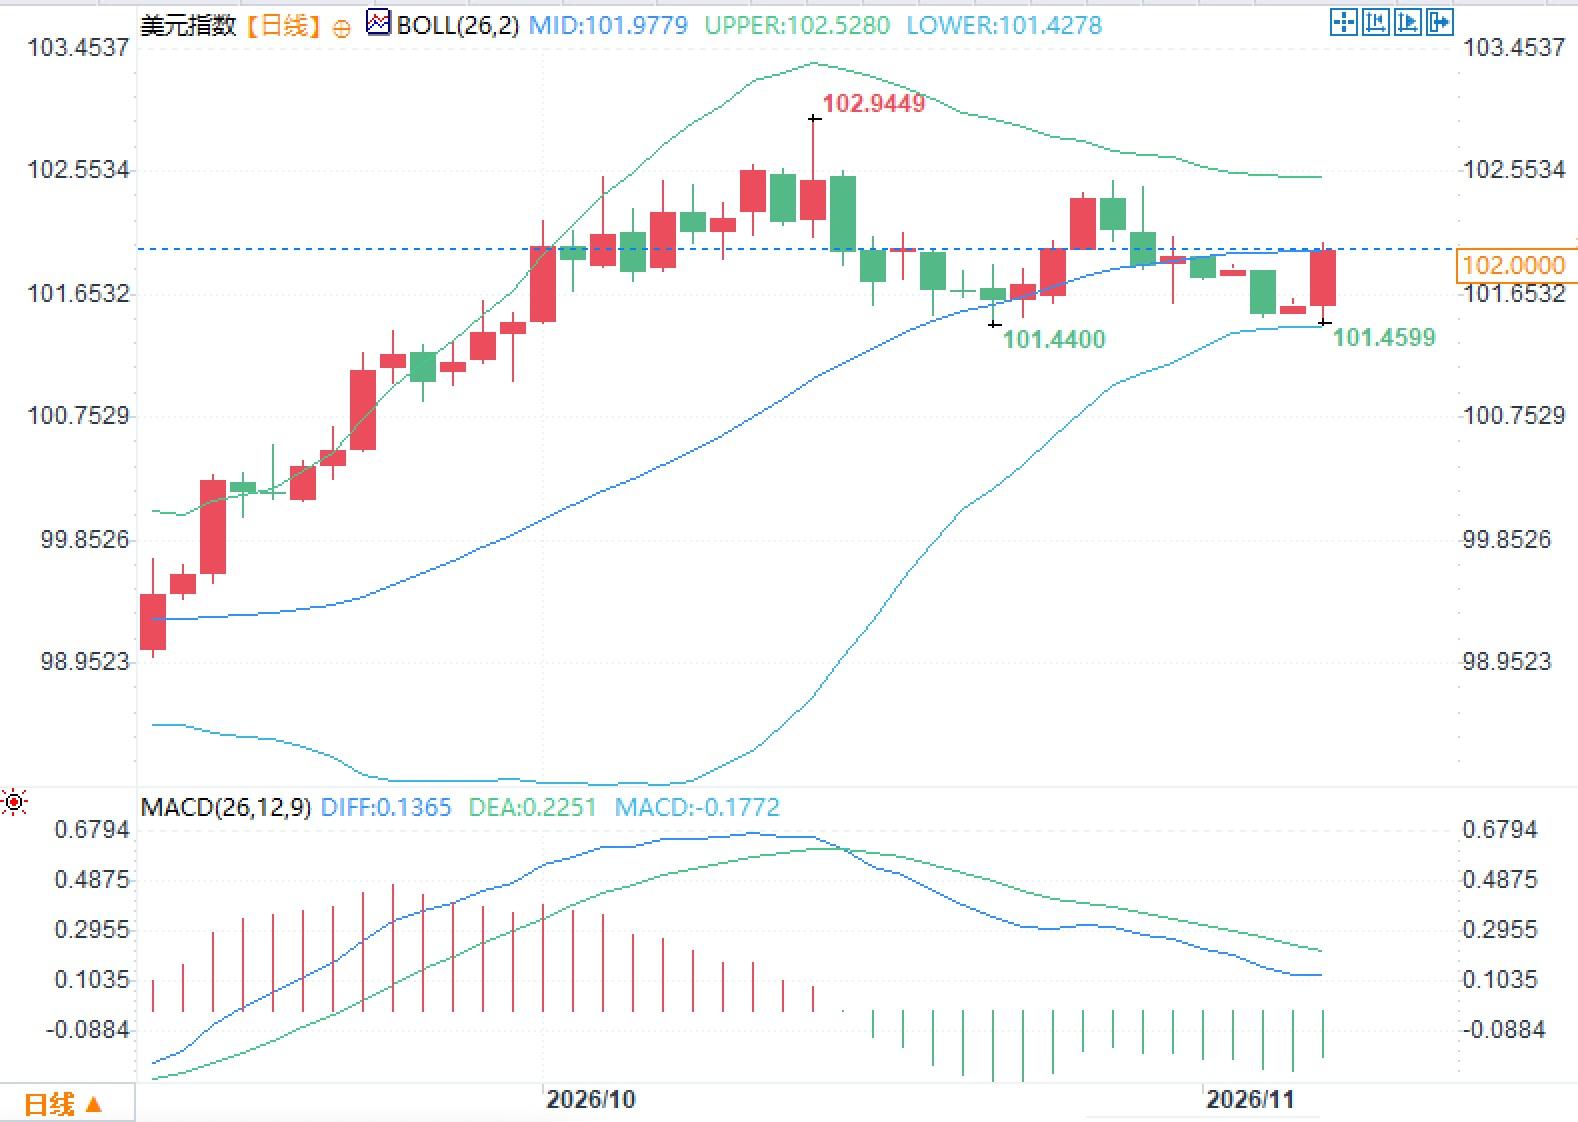
From the daily chart, the US Dollar Index's Bollinger Band middle band is around 101.9779, the upper band is at 102.5280, and the lower band is at 101.4278. Recently, the price has been trading near the middle Bollinger Band, having touched higher levels before pulling back, with notable points at 101.4400 and 101.4599. The MACD shows a DIFF of 0.1365, a DEA of 0.2251, and a histogram of -0.1772, with the histogram remaining below the zero line after turning negative. The relative positions of the price with the Bollinger Bands and MACD reflect a recent narrowing of volatility, with bulls and bears locked in a tug-of-war around the middle band, but the indicators themselves do not provide a clear directional signal. These objective patterns provide a framework for market observation before subsequent data releases.Data-dependent logic of policy stance
Williams' remarks align with the Fed's current target range for the federal funds rate of 3.75% to 4.00%. While emphasizing economic resilience, he did not weaken the requirement for inflation to return to its target, demonstrating a preference for assessing the risk balance through more information under a dual mandate. The temporary impact of tariffs and energy shocks was described as largely absorbed, while wage and expectation stability were used as supporting evidence for the observation window. This statement suggests that policymakers are more inclined to wait for further confirmation from key data such as employment and prices, rather than quickly adjusting their stance based on a single indicator. The description of a stable labor market echoes the recent unemployment rate remaining around 4.2%, but does not rule out the possibility of a reassessment due to subsequent changes.Key variables that the market is focusing on
The current market focus is on the upcoming US employment data and its potential impact on the inflation path. Williams noted the prolonged period of excessively high inflation and believes wage growth is in line with the target, making changes in the wage component and participation rate in the employment data a key focus. The transmission of energy prices to inflation has been described as being in line with expectations, but the residual effects of external supply shocks may still be reflected in subsequent data. The lag in policy effects requires policymakers to have a forward-looking perspective; therefore, post-data release interpretations will revolve around whether the risks have fully materialized. The US dollar index's movement around 102, along with the above information, forms the basis for the market's real-time pricing of policy pace; subsequent information updates will determine the specific form of fluctuations.Frequently Asked Questions
Question 1: Why did Williams emphasize that now is the right time to gather more information? Answer: He believes that economic resilience and labor market stability have provided a buffer, the impact of tariffs and energy shocks has been largely absorbed, and inflation expectations are anchored. Therefore, it is possible to wait for more data to verify the risk balance without rushing to adjust policy. Question 2: What are the current characteristics of the US Dollar Index technical chart? Answer: The price is trading near the middle Bollinger Band, with a range of approximately 101.43 to 102.53. The MACD histogram is below the zero line, reflecting recent narrowing volatility and a tug-of-war between bulls and bears near the middle band. Question 3: How does Williams' statement on inflation and employment reflect policy logic? Answer: He acknowledged that inflation has been excessively high for a considerable period and needs to return to 2% in due course. He also pointed out that wages and expectations are in line with targets and the labor market is stable. Therefore, he emphasized data reliance and forward-looking perspectives to avoid making hasty decisions based on a single piece of information.- Risk Warning and Disclaimer
- The market involves risk, and trading may not be suitable for all investors. This article is for reference only and does not constitute personal investment advice, nor does it take into account certain users’ specific investment objectives, financial situation, or other needs. Any investment decisions made based on this information are at your own risk.