













Crude oil plunges over 12% this week! War premium collapses instantly, $86 becomes a lifeline for bulls and bears.
2026-11-07 11:12:26
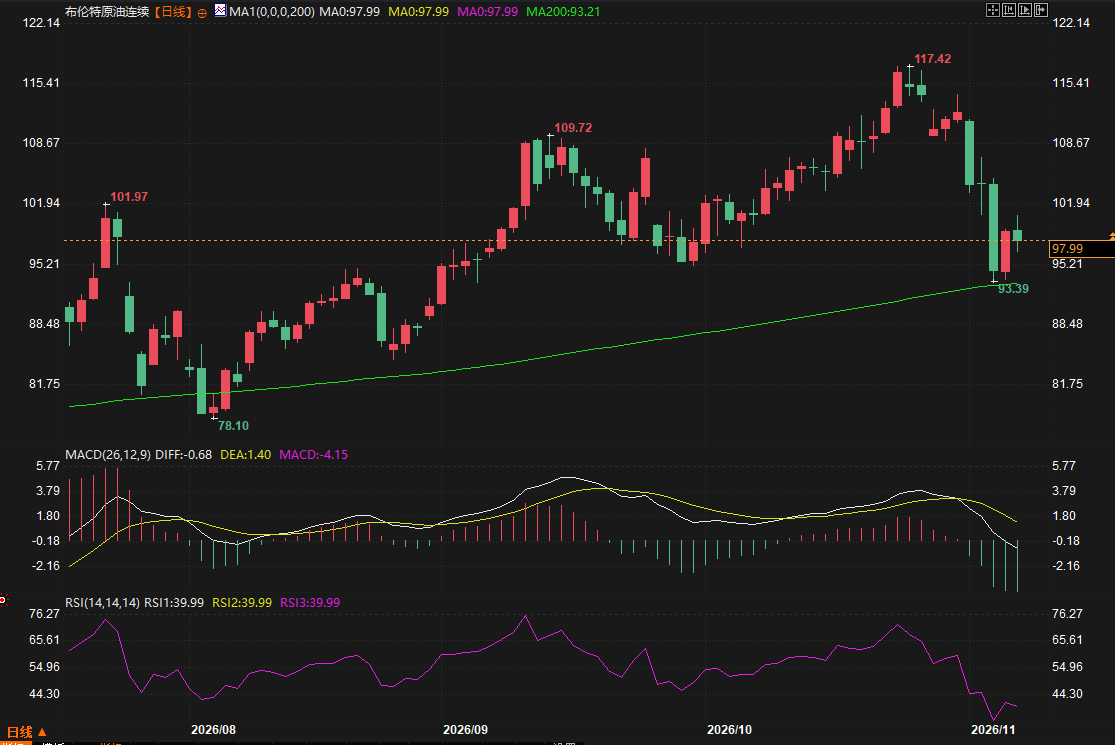
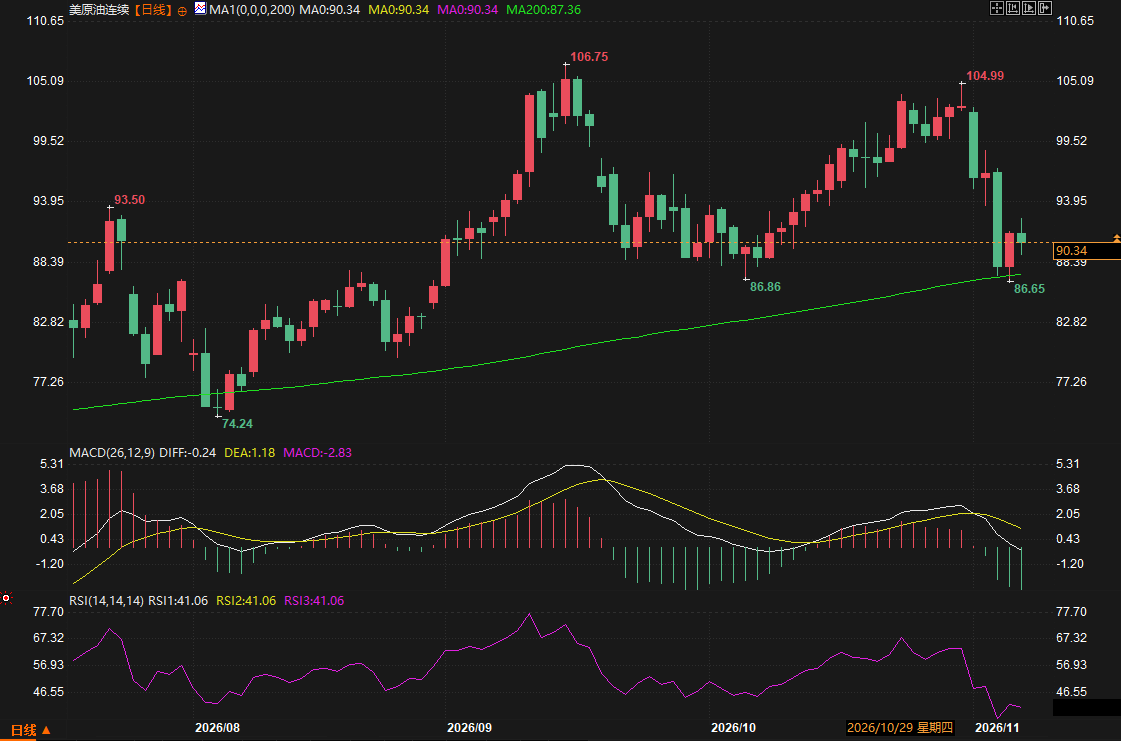
The international crude oil market experienced a rare plunge this week (November 2nd to 7th). WTI crude oil futures fell sharply from a high of $104.99 at the end of October, with four consecutive large bearish candles pushing prices to a low of $86.65, a weekly drop of approximately 11.76% to 13%. Brent crude oil plummeted from a high of $117.42 to $93.39, a weekly drop of over 12%, with some contracts even approaching 17%, marking the largest weekly decline since the outbreak of the pandemic (and one of the largest absolute drops since 1988). On Friday, prices rose slightly due to concerns about a possible renewed US attack on Iran, with WTI closing near $90.34 and Brent near $97.39.  The daily chart structure shows a typical accelerated decline after a top reversal: after a long upper shadow bearish candlestick at the high, the bodies of each subsequent candlestick are larger than the last, with almost no effective rebound. The latest candlestick shows a small body with a lower shadow (WTI) or a small bullish candlestick (Brent) near the low, releasing an initial signal of a bottom, but the overall trend remains deeply broken. Technical indicators are deteriorating simultaneously: WTI crude oil's MACD DIFF is -0.24 / DEA is 1.18, with the green bars expanding to -2.83, indicating increased bearish momentum after the death cross; the RSI is around 41, having just rebounded from a low. Brent crude oil's MACD green bars have expanded to -4.15, and the RSI is around 40. The price has broken below the rising MA200 (WTI crude oil barely held near 87.36), clearly indicating a shift from bullish to bearish.
 The heat map shows that WTI, Brent, unleaded gasoline, and fuel oil all fell sharply, with only natural gas rising against the trend, indicating a divergence in funds within the energy sector, while crude oil itself suffered a severe blow.
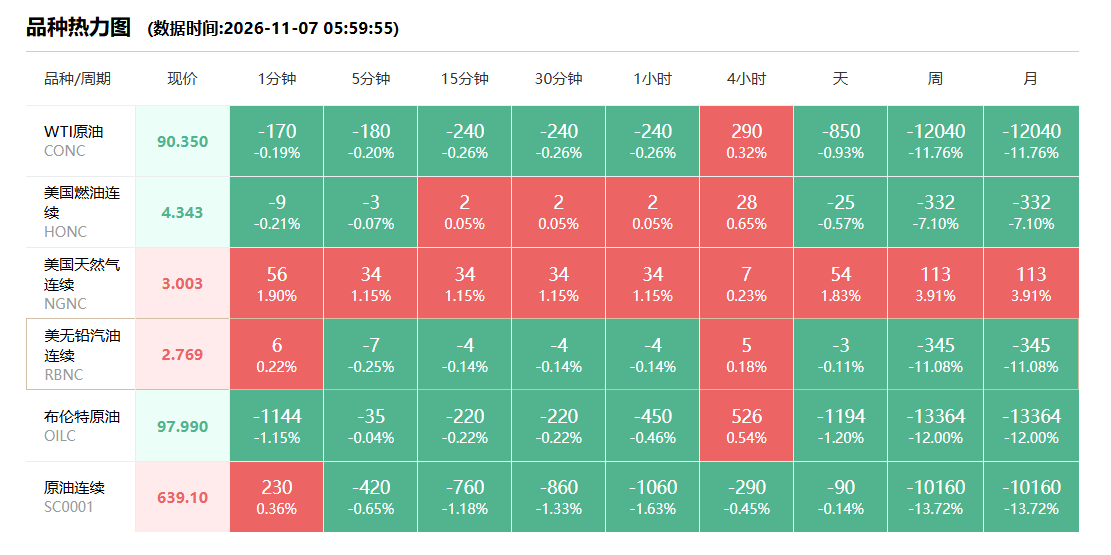
The daily chart structure shows a typical accelerated decline after a top reversal: after a long upper shadow bearish candlestick at the high, the bodies of each subsequent candlestick are larger than the last, with almost no effective rebound. The latest candlestick shows a small body with a lower shadow (WTI) or a small bullish candlestick (Brent) near the low, releasing an initial signal of a bottom, but the overall trend remains deeply broken. Technical indicators are deteriorating simultaneously: WTI crude oil's MACD DIFF is -0.24 / DEA is 1.18, with the green bars expanding to -2.83, indicating increased bearish momentum after the death cross; the RSI is around 41, having just rebounded from a low. Brent crude oil's MACD green bars have expanded to -4.15, and the RSI is around 40. The price has broken below the rising MA200 (WTI crude oil barely held near 87.36), clearly indicating a shift from bullish to bearish. The heat map shows that WTI, Brent, unleaded gasoline, and fuel oil all fell sharply, with only natural gas rising against the trend, indicating a divergence in funds within the energy sector, while crude oil itself suffered a severe blow. The core drivers of the decline: rapid retracement of the war premium + signals of oversupply.
The core catalyst for this round of sharp declines was the outcome of the US midterm elections. With the Democrats gaining control of both houses of Congress, the market quickly priced in the possibility that the "political deadlock" might prompt the Trump administration to seek détente with Iran, thereby reducing the risk of supply disruptions in the Middle East. Phil Flynn, senior analyst at Price Futures Group, bluntly stated, "The market currently seems to be slightly retracing the 'war premium.'" Wednesday's single-day drop exceeded 8%, with prices hitting a near two-month low. At the same time, fundamentals also showed clear signs of weakening. The Middle East crude oil spot premium has fallen back to pre-conflict levels, indicating increased oversupply pressure amid shrinking demand. Although tanker attacks in the Strait of Hormuz continued at near-record frequency (data from the UK Maritime Safety Authority UKMTO), briefly supporting prices on Wednesday and Thursday, they ultimately failed to prevent a significant weekly decline. Oil prices rose slightly on Friday, directly due to Trump's statement that he would soon decide "whether to seek a peace agreement or destroy the few remaining Iranian forces," prompting the market to re-priced in the possibility of renewed military action. Bob McNally, founder of Rapidan Energy Group, even gave an 80% probability of renewed military conflict and predicted that oil prices could return above $100. However, this concern only led to a technical rebound and failed to reverse the weekly downtrend.Institutional and market views: Short-term pressure, but geopolitical support remains at lower levels.
Most institutions believe that if the diplomatic path makes substantial progress and shipping routes fully return to normal, oil prices still have room to fall further. Commerzbank analyst Barbara Lambrecht pointed out that if diplomatic efforts look promising, oil prices may continue to decline, but "the risk of renewed escalation has never disappeared." ING commodities analysts believe that in the absence of escalation, the market will continue to slowly retrace the risk premium accumulated in recent months, and Persian Gulf oil flows remain good. KCM Trade chief analyst Tim Waterer emphasized that oil prices will still be supported during pullbacks until a credible, safer, and cheaper passage route to the Strait of Hormuz is found, and they are highly sensitive to any escalation headlines. ANZ strategist Daniel Hynes also cautioned that the sell-off has been excessive, as Iran still controls the strait, and actual traffic volume is still less than 60% of normal capacity. Technical traders are focusing on key levels: the US crude oil low of $86.65 and the 200-day moving average (around $87) form a short-term support zone; a break below this level could open up further downside potential; resistance is seen in the $95-$100 area. Brent crude oil has support around 93 and resistance at 100-105. While the MACD and RSI indicate bearish dominance, they have slightly rebounded from extremely oversold territory, suggesting a potential short-term technical rebound, but a trend reversal has not yet been confirmed. This week, crude oil underwent a dramatic shift from a "war premium" to a "rapid de-premium," with a weekly drop marking a record low in recent years, clearly indicating a shift from bullish to bearish technically. Geopolitical risks (tanker attacks, Trump's statements) continue to provide bottom support for prices, but oversupply and demand concerns continue to exert downward pressure.- Risk Warning and Disclaimer
- The market involves risk, and trading may not be suitable for all investors. This article is for reference only and does not constitute personal investment advice, nor does it take into account certain users’ specific investment objectives, financial situation, or other needs. Any investment decisions made based on this information are at your own risk.