













Gold retreated towards $4050 as US CPI data fueled speculation about a larger interest rate hike by the Federal Reserve.
2026-11-11 00:36:28
On Tuesday (November 10), during the US trading session, spot gold extended its intraday losses due to stronger-than-expected US inflation data. Gold prices gave back all of Monday's gains, while the US dollar strengthened in tandem. Spot gold traded around $4026.07, down 2.77%, below Monday's high of $4148.  Data from the U.S. Bureau of Labor Statistics showed that the U.S. Consumer Price Index (CPI) rose 0.4% month-over-month in October, higher than the market expectation of 0.3%, but lower than September's 0.6%. The core CPI, excluding food and energy, rose 0.3% month-over-month, unchanged from September, but higher than the expected 0.2%. Due to the government shutdown last year, the Bureau of Labor Statistics did not release year-over-year CPI data for October. The dollar index climbed above 102.00 after hitting a daily low of 101.49. The better-than-expected inflation data further solidified market expectations for a Federal Reserve rate hike in December. Earlier on Tuesday, Federal Reserve Governor Christopher Waller stated that even with a slight cooling in October inflation, he still supported a 25 basis point rate hike in December. He added that if the core CPI rose 0.3% or higher in October, a 50 basis point rate hike in December would be necessary. According to the CME FedWatch Tool, traders are currently betting on an 89.2% probability of a 25 basis point rate hike in December and a 10.8% probability of a 50 basis point hike. The Fed's hawkish stance continues to put downward pressure on gold prices: rising interest rates increase the opportunity cost of holding gold, a non-interest-bearing asset; a stronger dollar also makes it more expensive for buyers using other currencies to purchase gold. A survey conducted from November 6-10 showed that all 101 economists surveyed expect the Fed to raise rates by 25 basis points in December. However, opinions differ on the subsequent policy path: 56 economists believe December will be the last rate hike in this cycle, while 45 economists expect at least two more rate hikes. However, a continued decline in oil prices may alleviate inflationary pressures and reduce the need for the Fed to further tighten monetary policy. West Texas Intermediate (WTI) crude oil prices have fallen to $84 per barrel, the lowest since August 31, with a cumulative decline of over 15% this month. US President Trump said on Monday after meeting with the Qatari prime minister at the White House that there had been "positive progress" in ending the conflict with Iran. Technical analysis: Focus on the $4,000 level.
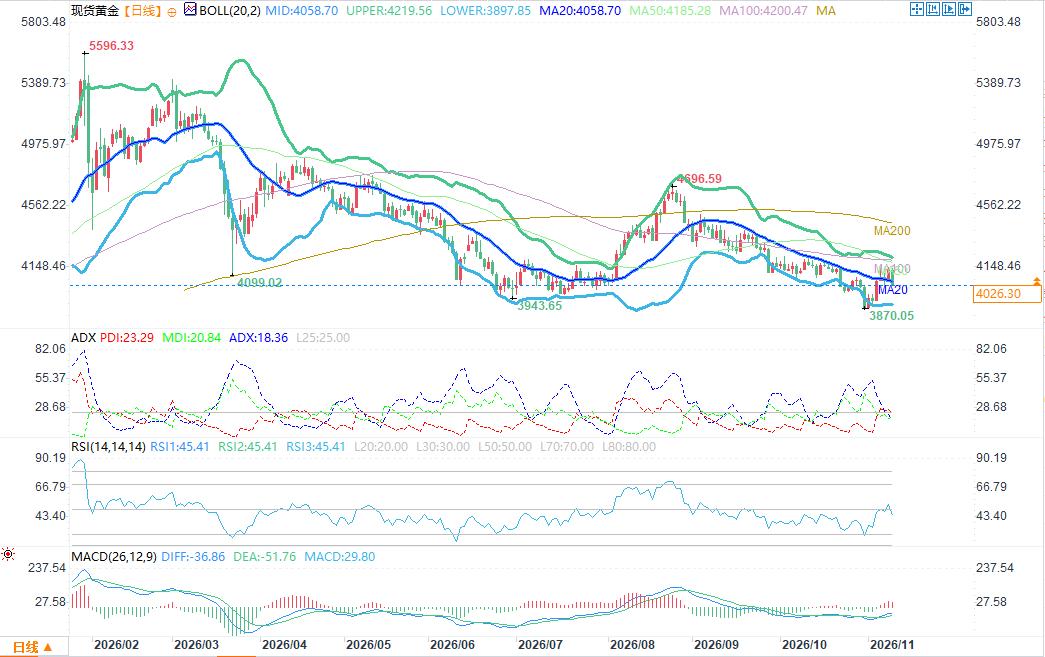 (Spot Gold Daily Chart Source: FX678) On the daily chart, spot gold is slightly bearish in the short term, with the price trading below the 20-day Bollinger Band Simple Moving Average (SMA, approximately $4059), but still within the Bollinger Band channel. The lower Bollinger Band (approximately $3900) is temporarily providing a buffer for the price; however, the price has failed to regain the middle Bollinger Band, limiting the upside potential. Market momentum is stabilizing: the Relative Strength Index (RSI) is slightly below the 50 level, and the MACD indicator remains positive; however, the Average Directional Movement Index (ADX) is only 24, indicating a weak current trend. Resistance levels: The first resistance is at the 20-day Bollinger Band around $4060, followed by the upper Bollinger Band at $4218; stronger horizontal resistance is at $4400, which will limit significant upward movement. Support levels: First psychological support is at $4,000; if it breaks down further, the next support level is the lower Bollinger Band at $3,901, followed by the year's low of $3,870.
Data from the U.S. Bureau of Labor Statistics showed that the U.S. Consumer Price Index (CPI) rose 0.4% month-over-month in October, higher than the market expectation of 0.3%, but lower than September's 0.6%. The core CPI, excluding food and energy, rose 0.3% month-over-month, unchanged from September, but higher than the expected 0.2%. Due to the government shutdown last year, the Bureau of Labor Statistics did not release year-over-year CPI data for October. The dollar index climbed above 102.00 after hitting a daily low of 101.49. The better-than-expected inflation data further solidified market expectations for a Federal Reserve rate hike in December. Earlier on Tuesday, Federal Reserve Governor Christopher Waller stated that even with a slight cooling in October inflation, he still supported a 25 basis point rate hike in December. He added that if the core CPI rose 0.3% or higher in October, a 50 basis point rate hike in December would be necessary. According to the CME FedWatch Tool, traders are currently betting on an 89.2% probability of a 25 basis point rate hike in December and a 10.8% probability of a 50 basis point hike. The Fed's hawkish stance continues to put downward pressure on gold prices: rising interest rates increase the opportunity cost of holding gold, a non-interest-bearing asset; a stronger dollar also makes it more expensive for buyers using other currencies to purchase gold. A survey conducted from November 6-10 showed that all 101 economists surveyed expect the Fed to raise rates by 25 basis points in December. However, opinions differ on the subsequent policy path: 56 economists believe December will be the last rate hike in this cycle, while 45 economists expect at least two more rate hikes. However, a continued decline in oil prices may alleviate inflationary pressures and reduce the need for the Fed to further tighten monetary policy. West Texas Intermediate (WTI) crude oil prices have fallen to $84 per barrel, the lowest since August 31, with a cumulative decline of over 15% this month. US President Trump said on Monday after meeting with the Qatari prime minister at the White House that there had been "positive progress" in ending the conflict with Iran. Technical analysis: Focus on the $4,000 level. (Spot Gold Daily Chart Source: FX678) On the daily chart, spot gold is slightly bearish in the short term, with the price trading below the 20-day Bollinger Band Simple Moving Average (SMA, approximately $4059), but still within the Bollinger Band channel. The lower Bollinger Band (approximately $3900) is temporarily providing a buffer for the price; however, the price has failed to regain the middle Bollinger Band, limiting the upside potential. Market momentum is stabilizing: the Relative Strength Index (RSI) is slightly below the 50 level, and the MACD indicator remains positive; however, the Average Directional Movement Index (ADX) is only 24, indicating a weak current trend. Resistance levels: The first resistance is at the 20-day Bollinger Band around $4060, followed by the upper Bollinger Band at $4218; stronger horizontal resistance is at $4400, which will limit significant upward movement. Support levels: First psychological support is at $4,000; if it breaks down further, the next support level is the lower Bollinger Band at $3,901, followed by the year's low of $3,870.
- Risk Warning and Disclaimer
- The market involves risk, and trading may not be suitable for all investors. This article is for reference only and does not constitute personal investment advice, nor does it take into account certain users’ specific investment objectives, financial situation, or other needs. Any investment decisions made based on this information are at your own risk.