













Why is the US non-farm payroll report so difficult to predict?
2026-11-11 01:32:28
Last Friday's latest US employment data once again shocked many economic forecasters. The series of inaccurate predictions raises a stark question: why do these analysts, who make a living by analyzing core economic indicators, frequently make such huge errors? Data from the US Bureau of Labor Statistics (BLS) shows that the US added 165,000 jobs in October, far exceeding the median forecast of 70,000 from a Bloomberg survey of over 70 economists. All forecasts deviated significantly from the actual results, with the highest forecast only reaching 131,000. Should we be concerned about the persistent and significant discrepancies between economists' expectations and official data, sometimes underestimating and sometimes overestimating? The answer is yes—this deviation exacerbates unnecessary volatility in financial markets. However, the root of the problem is not that the government deliberately manipulates data, nor is it due to a lack of professional competence among analysts. Consider the recent series of forecast mishaps: the October forecast differed from the actual value by 95,000, and this is not even the largest error this year. The forecast errors in February, March, July, and August all exceeded 100,000! In 2026, the average forecast error (regardless of whether it's an overestimation or underestimation) is approximately 88,000 people; in contrast, during the normal cycle of 2010-2019, the average error was only about 50,000 people. Economists have consistently made inaccurate predictions. 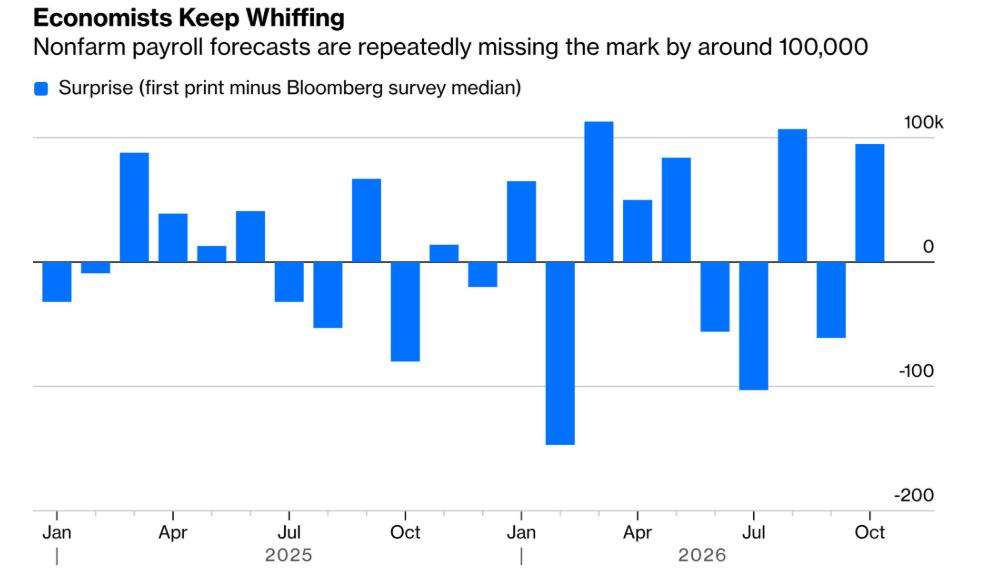 (Data source: Bloomberg, U.S. Bureau of Labor Statistics) To a large extent, this situation is an inevitable result of long-term underfunding of U.S. statistical agencies. The U.S. statistical system, once a global benchmark, now barely functions under continuously shrinking budgets. After adjusting for inflation, the Bureau of Labor Statistics' funding has been steadily declining; had it not been for congressional opposition, the previous Trump administration intended to cut budgets for employment, inflation, and GDP-related statistical items. Tighter budgets directly lead to smaller sample sizes, making it increasingly difficult for the Bureau of Labor Statistics to guarantee effective survey response rates. A former director of the Bureau of Labor Statistics stated in July: "The decline in survey response rates is a widespread phenomenon. On the one hand, it's harder to contact individuals and businesses than before; on the other hand, budget cuts primarily reduce resources for on-site surveys. The cost of contacting respondents is already rising, but the accompanying funding is insufficient, further dragging down response rates." All of these factors amplify the margin of error in employment data. Understanding this makes the increased volatility of data over the past decade less surprising. The current 90% confidence interval for non-farm payroll growth is approximately 122,000; monthly increases below this figure are statistically indistinguishable from zero growth. Approximately half of the employment reports in 2026 will fall into this category. The margin of error continues to widen .
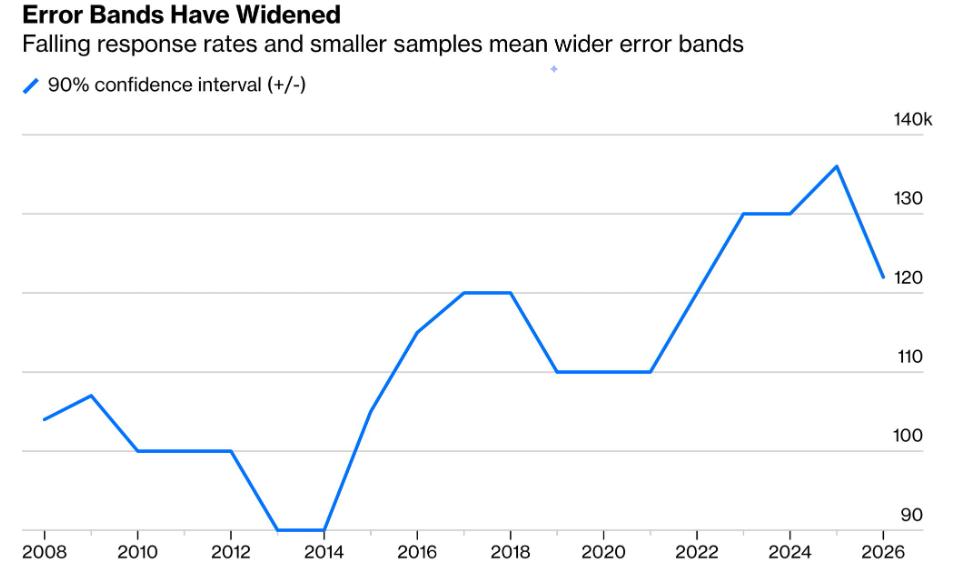 (Data source: U.S. Bureau of Labor Statistics) The second key point (viewpoint from Bloomberg columnist Catherine Anne Edwards): When job growth itself statistically approaches zero, the difficulty of prediction increases dramatically. The Trump administration's tightening of legal immigration policies and its high-pressure control over illegal immigration have blocked the flow of labor into the United States, which is one of the consequences. On a historical scale, the current monthly base for new jobs is low, and normal monthly noise can easily mask the true trend. Economists and statisticians find it difficult to distinguish real changes in the labor market from short-term random disturbances. Finally, there is a technical detail that is easily overlooked: the Bureau of Labor Statistics estimates non-farm payrolls by sampling companies, but new companies are constantly being created and old companies are constantly closing. For this part of job changes that cannot be directly sampled, the official estimate relies on a birth-death model, which has recently been iterated. The older version of the model smoothed out extrapolations based on lagged data, resulting in stable trends and being relatively friendly to analysts' predictions; however, its drawback was that it was difficult to accurately reflect the true economic situation. Starting in January 2026, the Bureau of Labor Statistics will use a new model that incorporates more high-frequency information, naturally resulting in greater volatility. The effectiveness of the new model remains to be seen, but it will undoubtedly make employment reports more difficult to predict. In summary, high volatility and unpredictability in employment data will become the norm. Researchers focusing on the labor market should focus on long-term trends and avoid overreacting to a single monthly report. While last Friday's strong employment data is certainly encouraging, it's difficult to extract reliable trend signals from it. At the same time, policymakers need to substantially increase the Bureau of Labor Statistics budget and implement reasonable immigration policies to supplement the economy's labor force. Perhaps only then will monthly job growth data be statistically clearly distinguishable from zero growth.
(Data source: Bloomberg, U.S. Bureau of Labor Statistics) To a large extent, this situation is an inevitable result of long-term underfunding of U.S. statistical agencies. The U.S. statistical system, once a global benchmark, now barely functions under continuously shrinking budgets. After adjusting for inflation, the Bureau of Labor Statistics' funding has been steadily declining; had it not been for congressional opposition, the previous Trump administration intended to cut budgets for employment, inflation, and GDP-related statistical items. Tighter budgets directly lead to smaller sample sizes, making it increasingly difficult for the Bureau of Labor Statistics to guarantee effective survey response rates. A former director of the Bureau of Labor Statistics stated in July: "The decline in survey response rates is a widespread phenomenon. On the one hand, it's harder to contact individuals and businesses than before; on the other hand, budget cuts primarily reduce resources for on-site surveys. The cost of contacting respondents is already rising, but the accompanying funding is insufficient, further dragging down response rates." All of these factors amplify the margin of error in employment data. Understanding this makes the increased volatility of data over the past decade less surprising. The current 90% confidence interval for non-farm payroll growth is approximately 122,000; monthly increases below this figure are statistically indistinguishable from zero growth. Approximately half of the employment reports in 2026 will fall into this category. The margin of error continues to widen . (Data source: U.S. Bureau of Labor Statistics) The second key point (viewpoint from Bloomberg columnist Catherine Anne Edwards): When job growth itself statistically approaches zero, the difficulty of prediction increases dramatically. The Trump administration's tightening of legal immigration policies and its high-pressure control over illegal immigration have blocked the flow of labor into the United States, which is one of the consequences. On a historical scale, the current monthly base for new jobs is low, and normal monthly noise can easily mask the true trend. Economists and statisticians find it difficult to distinguish real changes in the labor market from short-term random disturbances. Finally, there is a technical detail that is easily overlooked: the Bureau of Labor Statistics estimates non-farm payrolls by sampling companies, but new companies are constantly being created and old companies are constantly closing. For this part of job changes that cannot be directly sampled, the official estimate relies on a birth-death model, which has recently been iterated. The older version of the model smoothed out extrapolations based on lagged data, resulting in stable trends and being relatively friendly to analysts' predictions; however, its drawback was that it was difficult to accurately reflect the true economic situation. Starting in January 2026, the Bureau of Labor Statistics will use a new model that incorporates more high-frequency information, naturally resulting in greater volatility. The effectiveness of the new model remains to be seen, but it will undoubtedly make employment reports more difficult to predict. In summary, high volatility and unpredictability in employment data will become the norm. Researchers focusing on the labor market should focus on long-term trends and avoid overreacting to a single monthly report. While last Friday's strong employment data is certainly encouraging, it's difficult to extract reliable trend signals from it. At the same time, policymakers need to substantially increase the Bureau of Labor Statistics budget and implement reasonable immigration policies to supplement the economy's labor force. Perhaps only then will monthly job growth data be statistically clearly distinguishable from zero growth.
- Risk Warning and Disclaimer
- The market involves risk, and trading may not be suitable for all investors. This article is for reference only and does not constitute personal investment advice, nor does it take into account certain users’ specific investment objectives, financial situation, or other needs. Any investment decisions made based on this information are at your own risk.