













Following the CPI shockwave, the battle between bulls and bears around the $4,000 mark for gold continues.
2026-11-11 18:22:29
On Wednesday (November 11), during the Asian and European trading sessions, gold prices gradually stabilized and rebounded to the $4043-$4053 range. After experiencing a sharp sell-off of nearly 3% in the previous trading day, spot gold did not follow suit with a deep decline, showing strong resilience above the $4000/ounce level. The gold market is currently caught in a sharp contradiction: the unexpectedly hawkish tightening expectations stemming from the Fed's inflation rebound are providing sustained upward pressure on gold prices; while long-term sovereign wealth funds, primarily central banks, are continuously buying on dips, building solid bottom support. Coupled with marginal changes in geopolitical expectations and cross-market liquidity disturbances, the gold market has moved away from its previous one-sided trend and entered a phase of high volatility and wide-range fluctuations. The outcome of the battle between bulls and bears will depend on the release of subsequent US inflation data.  Fundamentals: Four Core Variables Intertwined, Pricing Logic Tearful Apart The essence of this round of gold price volatility lies in the significant divergence in pricing logic between two types of funds: leveraged speculative funds trade based on expectations of US Treasury yields and dollar interest rates, while sovereign reserve funds, based on long-term asset allocation, disregard short-term price fluctuations and continue to increase their holdings during pullbacks. Four main factors jointly determine the gold price range. 1. Short-Term Core Resistance: Inflation Rebound, Fed Tightening Expectations Rise Again The US October CPI data comprehensively exceeded market expectations, breaking the market's consensus expectation of a steady decline in inflation, becoming the trigger for this round of sharp gold price drops. Data shows that the overall CPI rose 0.4% month-on-month in October, higher than the market expectation of 0.3%; the core CPI, excluding food and energy, rose 0.3% month-on-month, with gasoline, motor vehicle insurance, and medical services being the main drivers of the inflation rebound. The resurgence of inflation directly prompted Fed officials to release hawkish statements. Federal Reserve Governor Waller explicitly stated that if inflation continues to overheat, more aggressive tightening measures should be taken; Philadelphia Fed President Anna Paulson also stated that continuing gradual interest rate hikes is the appropriate policy choice. CME FedWatch pricing adjusted rapidly accordingly, with the market fully pricing in a 25bp or 50 basis point rate hike in December, rising from 0% before the data release to 10%. This expectation has been transmitted to the asset side, with rising US Treasury yields and the dollar index stabilizing above 102.20, continuously increasing the opportunity cost of holding gold, a non-interest-bearing asset. This Friday's PPI and core PCE price index will be key to verifying the sustainability of inflation and are crucial variables in determining whether short-term hawkish expectations can further develop. Every instance of inflation data exceeding expectations will bring a new round of pressure to gold bulls. 2. Potential Downside Risks: Liquidity Surge and Retreating Geopolitical Premiums In a high-interest-rate environment, gold's safe-haven attributes risk becoming temporarily ineffective. When US stock valuations come under pressure and a rapid correction occurs, highly leveraged hedge funds face margin calls. Gold, as a highly liquid asset with substantial accumulated profits, often becomes the first target for selling and liquidation, triggering a technical sell-off and a "long squeeze." This is a significant reason why gold weakens in tandem with other risk assets during a sharp decline. Simultaneously, the marginal easing of geopolitical risks has, to some extent, diminished gold's safe-haven premium. Rising market expectations of a de-escalation of key geopolitical conflicts such as those between the US and Iran have led short-term speculative funds to take profits, leaving gold prices without sufficient safe-haven cushion against macroeconomic headwinds. 3. Bottom Support: Central Banks Buy Against the Trend, Locking in Downside Potential Although speculative longs exited the market en masse after the CPI news was released, the key support level of $4,000 was not easily breached, supported by long-term official allocations. Standard Chartered Bank's observations indicate that $4,000 is a key psychological and financial support level for gold prices in this round, and central bank gold purchases are the core guardian of this defense line. Latest data shows that the People's Bank of China increased its gold holdings by approximately 25.8 tons in October, marking the largest monthly increase since September 2023. The gold purchases by sovereign central banks and large reserve institutions are unleveraged, with the trading logic anchored to foreign exchange reserve diversification and long-term credit risk hedging, unaffected by short-term interest rate expectations. Whenever leveraged speculative trading is driven by macroeconomic data and liquidity panics, creating a pullback window, sovereign buying enters the market to absorb the losses, becoming a stabilizing force limiting the depth of gold price declines. This differentiated funding structure shapes the unique market characteristics of gold: negative news easily triggers rapid and sharp drops, but the duration of the decline is limited, with always some funds available to absorb the losses below. Technically: The 4-hour chart shows oversold correction, with significant resistance above.
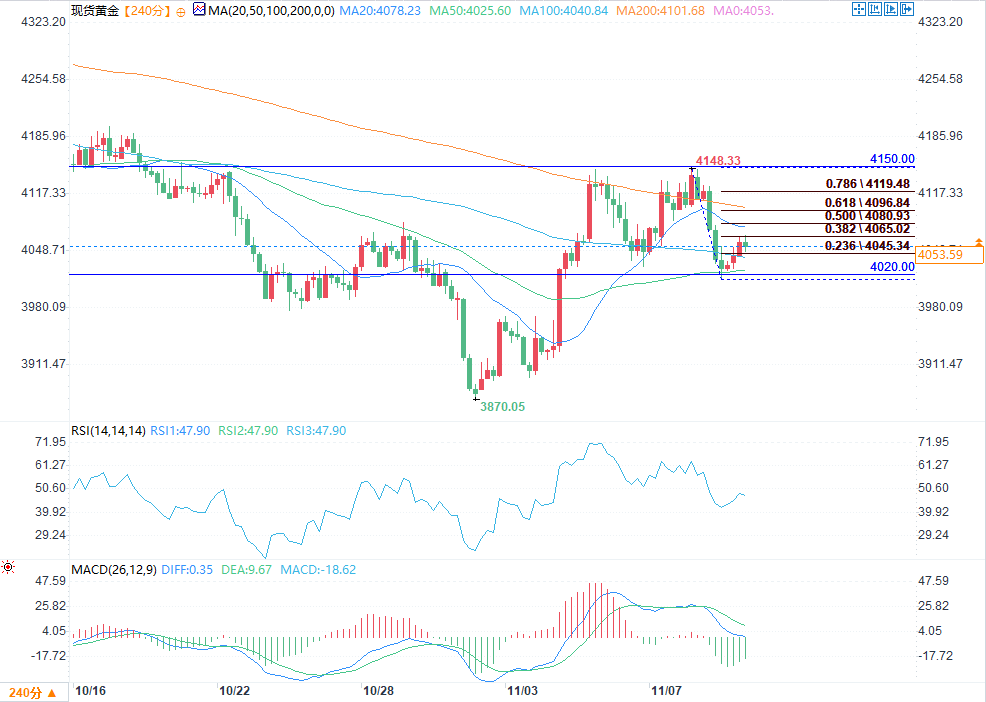 (Spot Gold 4-Hour Chart Source: EasyForex) Observing the 4-hour chart, the technical structure after the sharp drop in gold prices shows a clear pattern of "support below and resistance above." Currently, it is in a technical recovery phase after the plunge, and the short-term weak trend has not yet been reversed. After a rapid decline from the previous high of $4148.33, gold prices stabilized near the support level of $4020 and rebounded to around $4053.59. The current candlestick has regained its position above the two medium-term moving averages, MA50 (4025.60) and MA100 (4040.84), indicating effective short-term buying support and the release of oversold sentiment. However, the MA20 (4078.23) and the long-term bull-bear dividing line MA200 (4101.68) continue to exert downward pressure, limiting the rebound space and indicating that the short-term downtrend has not been completely reversed. Using the Fibonacci retracement calculation based on the downward wave from the high of 4148.33 to the low of this round: the gold price has stabilized above the 0.236 retracement level of 4045.34 and is testing the 0.382 retracement level of 4065.02; upward, the 0.5 retracement level of 4080.93 resonates strongly with the MA20, and the 0.618 Fibonacci retracement level of 4096.84 is close to the psychological level of 4100 US dollars and the MA200 moving average, which together form a strong resistance resonance zone, which is the watershed for whether the bulls can regain the initiative. The indicator signals also point to a weak recovery: the RSI (14) is currently at 47.90, turning upward from the previous weak range and entering the neutral range. The panic selling sentiment has subsided, and the short-term still has the momentum for a rebound; the MACD fast and slow lines maintain a death cross divergence, but the green bearish bars have narrowed significantly, and the bearish momentum has weakened marginally. This is a typical recovery signal after the decline, not a signal for the start of a new round of bullish trend. III. Scenario Analysis and Trading Observation Framework Based on both fundamental and technical factors, gold is likely to remain range-bound between $4020 and $4085 before the release of PPI and PCE inflation data. Bulls and bears will likely struggle around the boundaries of this range. We can divide the scenario into three scenarios and track key price signals: **Base Scenario: Range-Bound Consolidation Trigger Conditions:** PPI and PCE data meet expectations, and the US dollar index encounters resistance and falls back near 102.50. Key Levels: Support at $4020-$4040, resistance at $4080-$4100. Market Scenario: Gold prices repeatedly form a bottom above the 50-day and 100-day moving averages, testing the 20-day moving average resistance multiple times. This is suitable for a range-bound trading strategy; avoid chasing highs and lows, and wait for the boundary levels before making a decision. **Bullish Scenario: Breakout and Return to the Upward Channel Trigger Conditions:** Inflation data shows a significant cooling, or the US stock market experiences a sharp correction, leading to a market repricing and the Fed shifting to a dovish stance ahead of schedule. **Breakout Confirmation:** A firm hold above $4100; the target is the $4150 level. Market Outlook: After a successful breakout above the confluence of the 200-day moving average (MA200) and the 0.618 Fibonacci retracement level, the bullish trend has been restored, and the price is poised to retest the previous high of 4148.33. Bearish Scenario: A second dip to test the bottom could be triggered by: escalating expectations of a 50bp rate hike, or a cross-market liquidity crisis leading to a concentrated sell-off of gold positions. Breakout Confirmation: A significant drop below the $4020 support level; secondary support is at $4000, with deeper support at $3870.05. Market Outlook: After breaching $4020, the psychological level of $4000 will face a severe test; a decisive break below $4000 would open up further downside potential, targeting the previous low near $3870. Conclusion In the short term, the Fed's inflation expectations determine the ceiling for a gold price rebound, while the sovereign gold-buying power, represented by the People's Bank of China, determines the depth of this correction. Before the release of key inflation data, a one-sided trend is unlikely; high volatility and consolidation will be the main theme of the market. The $4,020 support level and the $4,080-$4,100 resistance zone are the key points to observe for the market trend in the coming period.
Fundamentals: Four Core Variables Intertwined, Pricing Logic Tearful Apart The essence of this round of gold price volatility lies in the significant divergence in pricing logic between two types of funds: leveraged speculative funds trade based on expectations of US Treasury yields and dollar interest rates, while sovereign reserve funds, based on long-term asset allocation, disregard short-term price fluctuations and continue to increase their holdings during pullbacks. Four main factors jointly determine the gold price range. 1. Short-Term Core Resistance: Inflation Rebound, Fed Tightening Expectations Rise Again The US October CPI data comprehensively exceeded market expectations, breaking the market's consensus expectation of a steady decline in inflation, becoming the trigger for this round of sharp gold price drops. Data shows that the overall CPI rose 0.4% month-on-month in October, higher than the market expectation of 0.3%; the core CPI, excluding food and energy, rose 0.3% month-on-month, with gasoline, motor vehicle insurance, and medical services being the main drivers of the inflation rebound. The resurgence of inflation directly prompted Fed officials to release hawkish statements. Federal Reserve Governor Waller explicitly stated that if inflation continues to overheat, more aggressive tightening measures should be taken; Philadelphia Fed President Anna Paulson also stated that continuing gradual interest rate hikes is the appropriate policy choice. CME FedWatch pricing adjusted rapidly accordingly, with the market fully pricing in a 25bp or 50 basis point rate hike in December, rising from 0% before the data release to 10%. This expectation has been transmitted to the asset side, with rising US Treasury yields and the dollar index stabilizing above 102.20, continuously increasing the opportunity cost of holding gold, a non-interest-bearing asset. This Friday's PPI and core PCE price index will be key to verifying the sustainability of inflation and are crucial variables in determining whether short-term hawkish expectations can further develop. Every instance of inflation data exceeding expectations will bring a new round of pressure to gold bulls. 2. Potential Downside Risks: Liquidity Surge and Retreating Geopolitical Premiums In a high-interest-rate environment, gold's safe-haven attributes risk becoming temporarily ineffective. When US stock valuations come under pressure and a rapid correction occurs, highly leveraged hedge funds face margin calls. Gold, as a highly liquid asset with substantial accumulated profits, often becomes the first target for selling and liquidation, triggering a technical sell-off and a "long squeeze." This is a significant reason why gold weakens in tandem with other risk assets during a sharp decline. Simultaneously, the marginal easing of geopolitical risks has, to some extent, diminished gold's safe-haven premium. Rising market expectations of a de-escalation of key geopolitical conflicts such as those between the US and Iran have led short-term speculative funds to take profits, leaving gold prices without sufficient safe-haven cushion against macroeconomic headwinds. 3. Bottom Support: Central Banks Buy Against the Trend, Locking in Downside Potential Although speculative longs exited the market en masse after the CPI news was released, the key support level of $4,000 was not easily breached, supported by long-term official allocations. Standard Chartered Bank's observations indicate that $4,000 is a key psychological and financial support level for gold prices in this round, and central bank gold purchases are the core guardian of this defense line. Latest data shows that the People's Bank of China increased its gold holdings by approximately 25.8 tons in October, marking the largest monthly increase since September 2023. The gold purchases by sovereign central banks and large reserve institutions are unleveraged, with the trading logic anchored to foreign exchange reserve diversification and long-term credit risk hedging, unaffected by short-term interest rate expectations. Whenever leveraged speculative trading is driven by macroeconomic data and liquidity panics, creating a pullback window, sovereign buying enters the market to absorb the losses, becoming a stabilizing force limiting the depth of gold price declines. This differentiated funding structure shapes the unique market characteristics of gold: negative news easily triggers rapid and sharp drops, but the duration of the decline is limited, with always some funds available to absorb the losses below. Technically: The 4-hour chart shows oversold correction, with significant resistance above. (Spot Gold 4-Hour Chart Source: EasyForex) Observing the 4-hour chart, the technical structure after the sharp drop in gold prices shows a clear pattern of "support below and resistance above." Currently, it is in a technical recovery phase after the plunge, and the short-term weak trend has not yet been reversed. After a rapid decline from the previous high of $4148.33, gold prices stabilized near the support level of $4020 and rebounded to around $4053.59. The current candlestick has regained its position above the two medium-term moving averages, MA50 (4025.60) and MA100 (4040.84), indicating effective short-term buying support and the release of oversold sentiment. However, the MA20 (4078.23) and the long-term bull-bear dividing line MA200 (4101.68) continue to exert downward pressure, limiting the rebound space and indicating that the short-term downtrend has not been completely reversed. Using the Fibonacci retracement calculation based on the downward wave from the high of 4148.33 to the low of this round: the gold price has stabilized above the 0.236 retracement level of 4045.34 and is testing the 0.382 retracement level of 4065.02; upward, the 0.5 retracement level of 4080.93 resonates strongly with the MA20, and the 0.618 Fibonacci retracement level of 4096.84 is close to the psychological level of 4100 US dollars and the MA200 moving average, which together form a strong resistance resonance zone, which is the watershed for whether the bulls can regain the initiative. The indicator signals also point to a weak recovery: the RSI (14) is currently at 47.90, turning upward from the previous weak range and entering the neutral range. The panic selling sentiment has subsided, and the short-term still has the momentum for a rebound; the MACD fast and slow lines maintain a death cross divergence, but the green bearish bars have narrowed significantly, and the bearish momentum has weakened marginally. This is a typical recovery signal after the decline, not a signal for the start of a new round of bullish trend. III. Scenario Analysis and Trading Observation Framework Based on both fundamental and technical factors, gold is likely to remain range-bound between $4020 and $4085 before the release of PPI and PCE inflation data. Bulls and bears will likely struggle around the boundaries of this range. We can divide the scenario into three scenarios and track key price signals: **Base Scenario: Range-Bound Consolidation Trigger Conditions:** PPI and PCE data meet expectations, and the US dollar index encounters resistance and falls back near 102.50. Key Levels: Support at $4020-$4040, resistance at $4080-$4100. Market Scenario: Gold prices repeatedly form a bottom above the 50-day and 100-day moving averages, testing the 20-day moving average resistance multiple times. This is suitable for a range-bound trading strategy; avoid chasing highs and lows, and wait for the boundary levels before making a decision. **Bullish Scenario: Breakout and Return to the Upward Channel Trigger Conditions:** Inflation data shows a significant cooling, or the US stock market experiences a sharp correction, leading to a market repricing and the Fed shifting to a dovish stance ahead of schedule. **Breakout Confirmation:** A firm hold above $4100; the target is the $4150 level. Market Outlook: After a successful breakout above the confluence of the 200-day moving average (MA200) and the 0.618 Fibonacci retracement level, the bullish trend has been restored, and the price is poised to retest the previous high of 4148.33. Bearish Scenario: A second dip to test the bottom could be triggered by: escalating expectations of a 50bp rate hike, or a cross-market liquidity crisis leading to a concentrated sell-off of gold positions. Breakout Confirmation: A significant drop below the $4020 support level; secondary support is at $4000, with deeper support at $3870.05. Market Outlook: After breaching $4020, the psychological level of $4000 will face a severe test; a decisive break below $4000 would open up further downside potential, targeting the previous low near $3870. Conclusion In the short term, the Fed's inflation expectations determine the ceiling for a gold price rebound, while the sovereign gold-buying power, represented by the People's Bank of China, determines the depth of this correction. Before the release of key inflation data, a one-sided trend is unlikely; high volatility and consolidation will be the main theme of the market. The $4,020 support level and the $4,080-$4,100 resistance zone are the key points to observe for the market trend in the coming period.
- Risk Warning and Disclaimer
- The market involves risk, and trading may not be suitable for all investors. This article is for reference only and does not constitute personal investment advice, nor does it take into account certain users’ specific investment objectives, financial situation, or other needs. Any investment decisions made based on this information are at your own risk.

