












The crude oil market continues to be under pressure, with the future direction of the US-Iran situation remaining unclear.
2026-11-12 19:00:29
Due to the uncertainty surrounding the US-Iran situation, traders are finding it difficult to predict future trends, and crude oil prices have been fluctuating within a low range recently.  The US-Iran conflict undoubtedly remains the core factor driving oil price movements. While diplomatic efforts have shown some signs of progress, no substantial breakthrough has been achieved. The Wall Street Journal reported that US Vice President Vance is considering face-to-face talks with senior Iranian security officials in an effort to end the war, a report that caused oil prices to fall yesterday. However, serious distrust remains between the two sides. Iranian officials accuse Washington of preparing a new round of military strikes or planning more severe economic pressure. Iran has also continued to warn of retaliation against US military bases; reports also indicate that Iran has attacked navigation systems for ships near the Strait of Hormuz. Meanwhile, the US military states that its blockade has cut off Iranian oil exports and that it is working to ensure the passage of commercial shipping through the Strait of Hormuz. These conflicting signals create high uncertainty in the market outlook, making oil prices highly sensitive to any developments that could ease tensions or escalate the conflict. Undoubtedly, if negotiations achieve a substantial breakthrough, the market will experience a large-scale sell-off, and oil prices will quickly fall back to pre-war levels. Conversely, escalating conflict could raise risk premiums, pushing oil prices higher again; however, if Trump only launches limited strikes to save face before ending the war, this round of oil price increases may be short-lived. Crude Oil Technical Analysis – Daily Chart
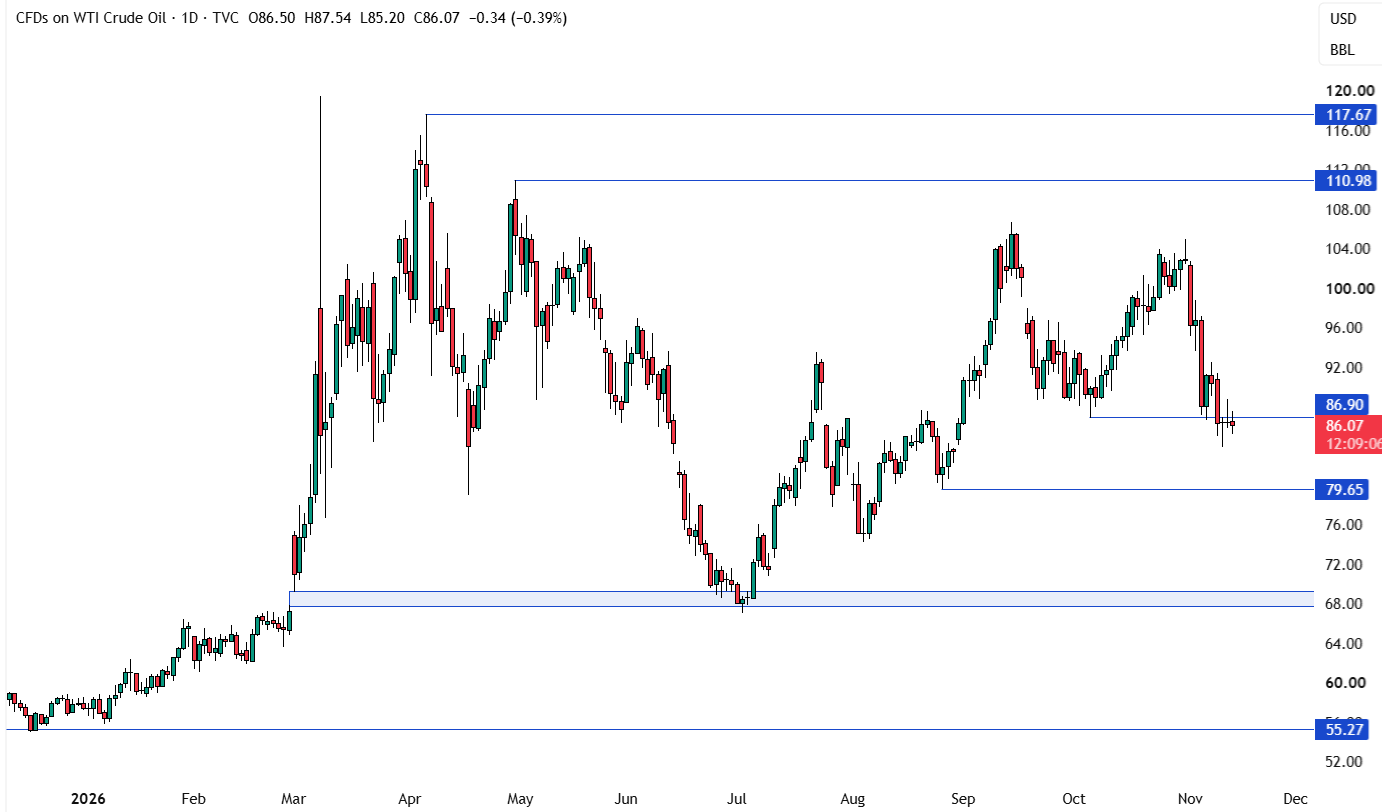 As seen on the daily chart, the US crude oil CFD (USOIL) is consolidating around the key $87.00 level. The uncertainty surrounding the US-Iran situation is causing repeated price fluctuations, making it difficult for either bulls or bears to establish a clear trading direction. Bulls need to see the price break above $87.00 before considering long positions and aiming for new highs; while bears will likely add to their positions after the price falls below $87.00, anticipating further declines to new lows. Crude Oil Technical Analysis – 4-Hour Chart
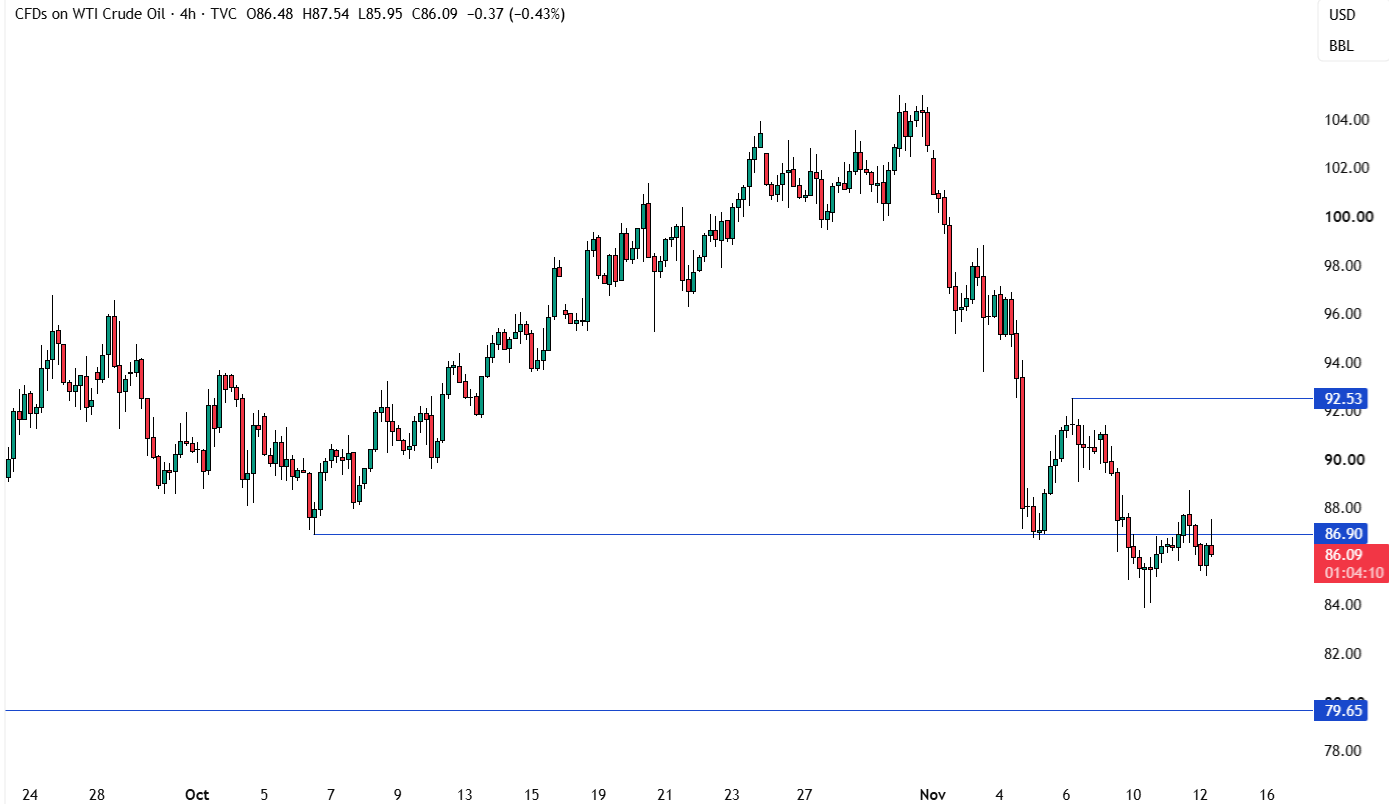 On the 4-hour chart, the price is fluctuating around the 87.00 level. It's difficult to find effective signals on this timeframe; a smaller timeframe is needed for further observation. Crude Oil Technical Analysis – 1-Hour Chart
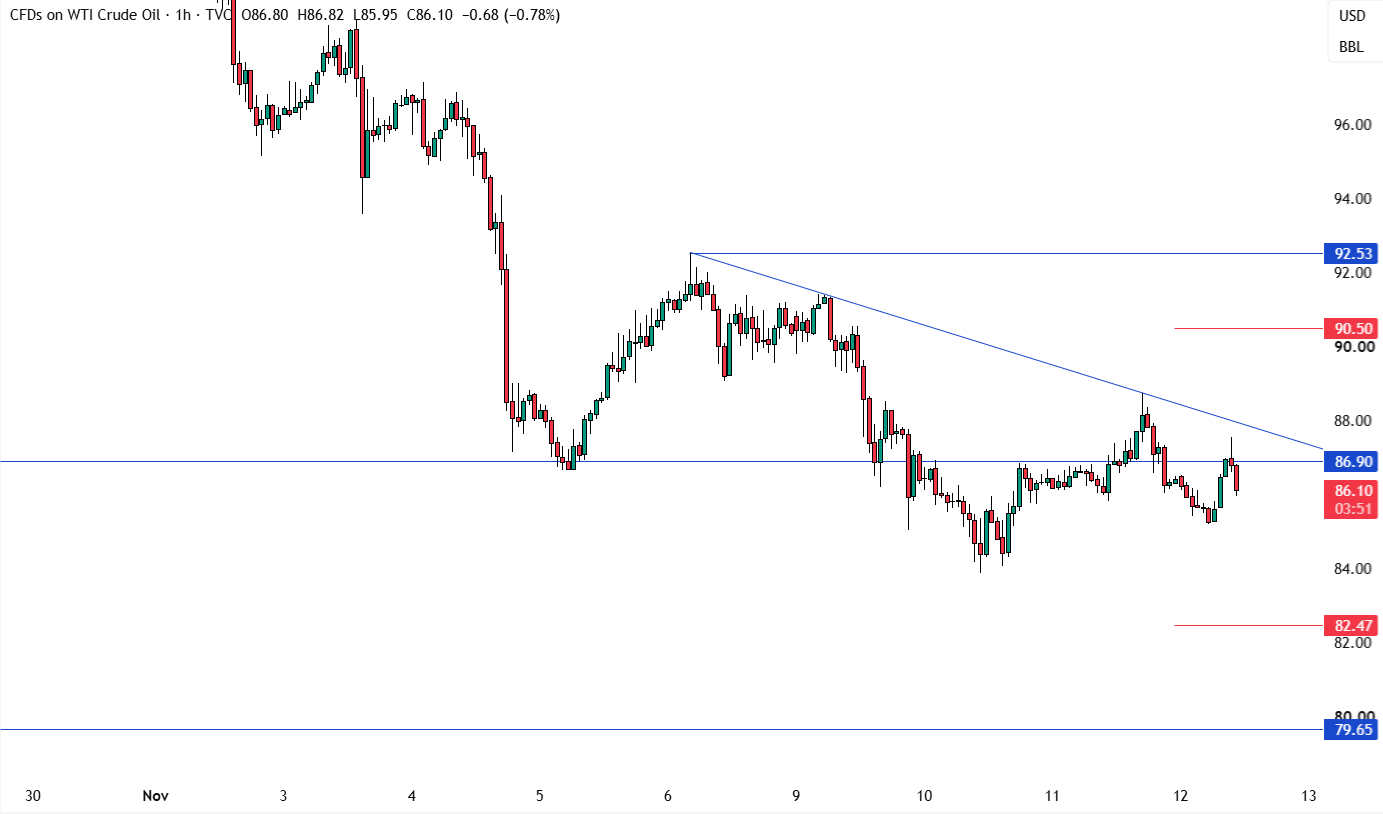 On the hourly chart, a slight downward trendline outlines the current bearish market structure. It is expected that the bears will continue to exert pressure based on this trendline, with stop-loss orders placed above the trendline, and the next target at the 80.00 level. Conversely, the bulls need an upward breakout before entering long positions, targeting the 110.00 resistance level, with the first target at 92.50. The red line in the chart represents today's average daily trading range (ADR). Upcoming Market Catalysts The US will release its latest initial jobless claims data; tomorrow, the US Producer Price Index (PPI) will conclude this week's economic data. The core focus of the market remains the development of the US-Iran situation.
The US-Iran conflict undoubtedly remains the core factor driving oil price movements. While diplomatic efforts have shown some signs of progress, no substantial breakthrough has been achieved. The Wall Street Journal reported that US Vice President Vance is considering face-to-face talks with senior Iranian security officials in an effort to end the war, a report that caused oil prices to fall yesterday. However, serious distrust remains between the two sides. Iranian officials accuse Washington of preparing a new round of military strikes or planning more severe economic pressure. Iran has also continued to warn of retaliation against US military bases; reports also indicate that Iran has attacked navigation systems for ships near the Strait of Hormuz. Meanwhile, the US military states that its blockade has cut off Iranian oil exports and that it is working to ensure the passage of commercial shipping through the Strait of Hormuz. These conflicting signals create high uncertainty in the market outlook, making oil prices highly sensitive to any developments that could ease tensions or escalate the conflict. Undoubtedly, if negotiations achieve a substantial breakthrough, the market will experience a large-scale sell-off, and oil prices will quickly fall back to pre-war levels. Conversely, escalating conflict could raise risk premiums, pushing oil prices higher again; however, if Trump only launches limited strikes to save face before ending the war, this round of oil price increases may be short-lived. Crude Oil Technical Analysis – Daily Chart As seen on the daily chart, the US crude oil CFD (USOIL) is consolidating around the key $87.00 level. The uncertainty surrounding the US-Iran situation is causing repeated price fluctuations, making it difficult for either bulls or bears to establish a clear trading direction. Bulls need to see the price break above $87.00 before considering long positions and aiming for new highs; while bears will likely add to their positions after the price falls below $87.00, anticipating further declines to new lows. Crude Oil Technical Analysis – 4-Hour Chart On the 4-hour chart, the price is fluctuating around the 87.00 level. It's difficult to find effective signals on this timeframe; a smaller timeframe is needed for further observation. Crude Oil Technical Analysis – 1-Hour Chart On the hourly chart, a slight downward trendline outlines the current bearish market structure. It is expected that the bears will continue to exert pressure based on this trendline, with stop-loss orders placed above the trendline, and the next target at the 80.00 level. Conversely, the bulls need an upward breakout before entering long positions, targeting the 110.00 resistance level, with the first target at 92.50. The red line in the chart represents today's average daily trading range (ADR). Upcoming Market Catalysts The US will release its latest initial jobless claims data; tomorrow, the US Producer Price Index (PPI) will conclude this week's economic data. The core focus of the market remains the development of the US-Iran situation.
- Risk Warning and Disclaimer
- The market involves risk, and trading may not be suitable for all investors. This article is for reference only and does not constitute personal investment advice, nor does it take into account certain users’ specific investment objectives, financial situation, or other needs. Any investment decisions made based on this information are at your own risk.